Summary:
In this article I will review how you can configure ExtraHop to get Multi-Tenant stats and dashboards which should resonate as a value add with any CSPs. It involves using ExtraHop triggers and some basic javascript. Once you understand this concept the world of possibilities open up.
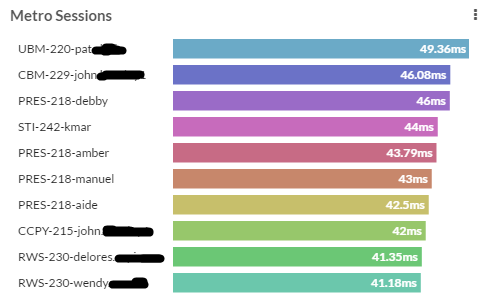
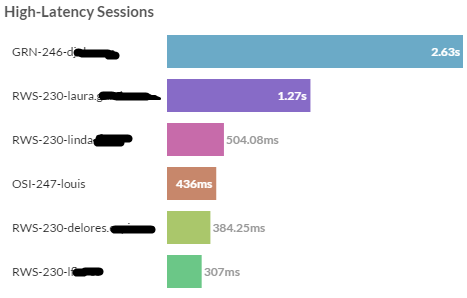
Items like ICA Latency Per User but having the “Customer” name and VLAN ID added to user name.
DNS errors by client


I debated if I should write this article and risk sharing our competitive secrets with the world. However after further reflection I determined that the team at ExtraHop has been so accommodating by bringing our Technical Team up to speed on the product and providing NFR software that my desire for secrecy was outweighed by trying to put good and accurate information on the web about ExtraHop. They really make a great product and deserve to have people who stand by it endorse it….and it is SO different than typical monitoring tools that they need information from unbiased sources readily available. A special thanks go out to Lance and Ken from ExtraHop who have given CIO Solutions to training and support needed to learn the product. CIO Solutions is unique because we have lots of customers and look like a traditional VAR but we also have some a private cloud infrastructure which allows us to really test and get the know the products in a production environment. The devil is in the details with these types of monitoring products and the support and software ExtraHop has provided us goes a long way towards ensuring we can also help our mutual customers at a deep level.
Simply put ExtraHop is the most flexible and comprehensive analytical monitoring tool on the market providing insights and visibility that no other product comes close to. If you have found yourself aimlessly searching for new monitoring tools only to look under the hood and determine that they all provide you with the same types of data then ExtraHop will be a breath of fresh air. Out of the box it has great information but there is a lot more that it can do and with a bit of customization the power is magnified.
Multi-Tenant Challenges
Multi-Tenant private clouds have some unique challenges that an out of the box ExtraHop deployment doesn’t handle…without some adjustments to the triggers and dashboards. I listed some of these Multi-Tenant challenges below.
- The Atomic Unit is really a customer…which tends to correspond to a single subnet.
- The customer may only have a few VM’s and likely not “heavy hitter” vm’s like you would find in an enterprise or SaaS company.
- Getting East/West traffic is important as often times customer VM’s will live on the same host.
- A given customer’s traffic only makes up a small percentage of total traffic so typical views into traffic patterns don’t let you understand what is happening on a customer level.
- Citrix tends to be involved for application delivery
- There are likely multiple domains and/or a shared domain. In addition to a shard domain you might also have other shared services, monitoring would be an example.
- A CSP competes with the big IaaS boys based on superior performance, advanced troubleshooting and holistic solutions. This means we need enterprise grade tools that are beyond typical MSP style tools.
Getting Data to ExtraHop
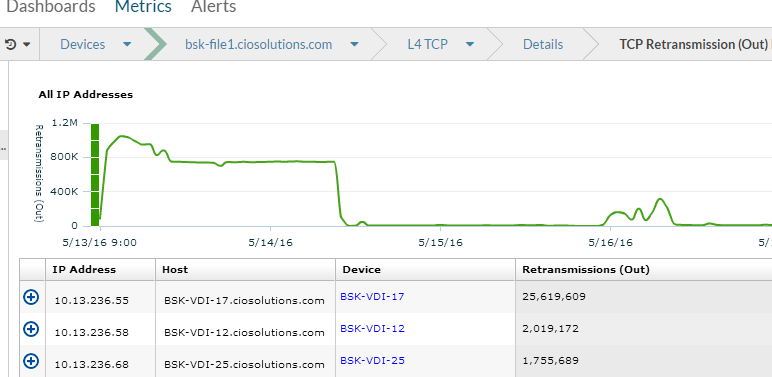
We used a L3 Encapsulation through VMWare vDS to enable us to capture east/west traffic. I wrote another article about how to do this <here>. As a side note and not documented in that article, we had to turn on a special command in ExtraHop that ensured that the ExtraHop didn’t see the duplicate traffic as “retransmissions. Support has to turn on this command. See screenshot below of before and after this command was enabled. Prior to turning that command on ExtraHop made us feel like our network was running like Crap with all the retransmissions.
Zero Windows and RPOs – The part of the Stack between the Network and the Application
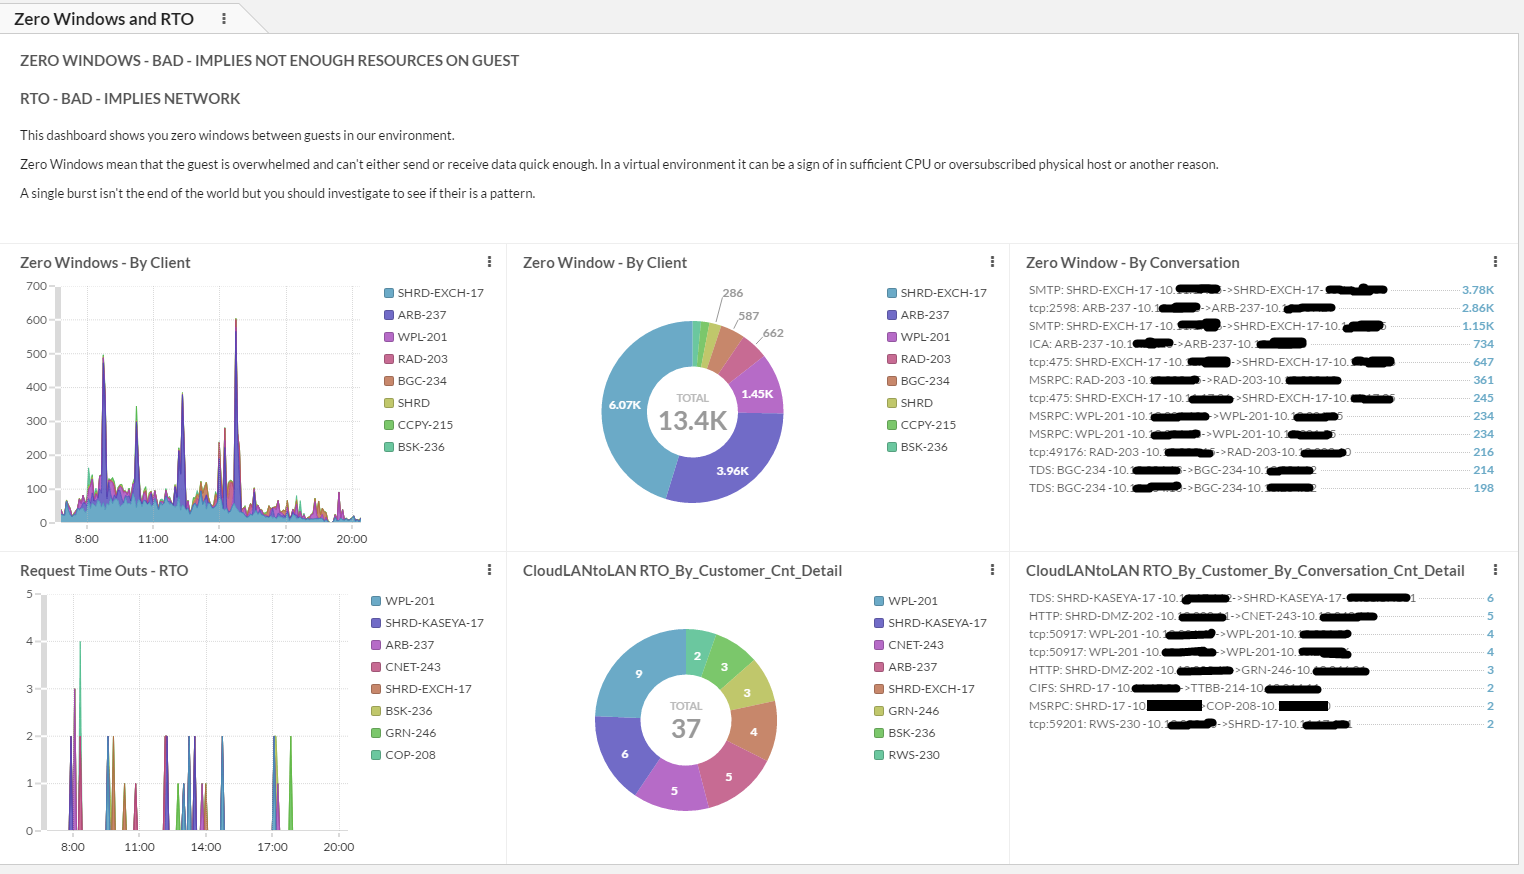
Zero Windows are a sign that the guest doesn’t have sufficient resources whereas RPOs let you know the problem is between the client VM and server VM, i.e the network. Take a second to understand this -> with ExtraHop you can determine if poor performance at L4 is due to Client Resource Issues(Zero Window) or Network(RTO)! To best view these Stats in a multi-tenant world I created a dashboard that shows these critical stats by customer and by conversation. This allows us to quickly see if any issues exist and if so which customer they may be impacting. We are really just aggregating all the IP addresses for a given customer in a single unique key that is the customer name(or in our case a Three Letter Abbreviation) rather than the IP address. Of course once I want to drill down further I can use the out of the box ExtraHop “Metrics” and understand exactly what is happening. The key is that the dashboards and custom metrics give me the right high level view which is “customer” centric. Some things to take note of in terms of our design
- I only wanted to see traffic between VM’s that we control, i.e. on our 10Gbs network. This means I can filter out ZeroWindows and RTOs that come from the internet or over VPN. That’s not to say that LAN to Internet traffic isn’t important but it is a different troubleshooting process and would require a separate view. Lets take from example an Exchange CAS server talking to many mobile phones on who knows what type of network, do I really want to see this?
- I did not separate out ZeroWndIn from ZeroWndOut or RTOin and RTOout because I figured this actually provides too much data for an at a glance view(IMO) and I can always drill down to find out this information.
- When a customer servers talks to a shared services server I count that as a stat for the customer. When a shared services server talks to a shared services server I count that for the shared services.
- I put the VLANID which is also the 3rd Octet of the IP address after the customer name. This helps identify a mistake in lookup and mirrors our naming scheme in other platforms, such as port groups in vmware.
- We named the Trigger “CSP – TCP L4 Metrics” and the Dashbaord “CSP – ZeroWindow and RTO”
- YES…our one of our Exchange Mailbox Servers is having ZeroWindows with our Exchange CAS servers. This is being investigated.
Customer Device to Dashboard – A step by step in how we created the “CSP Zero Window View”
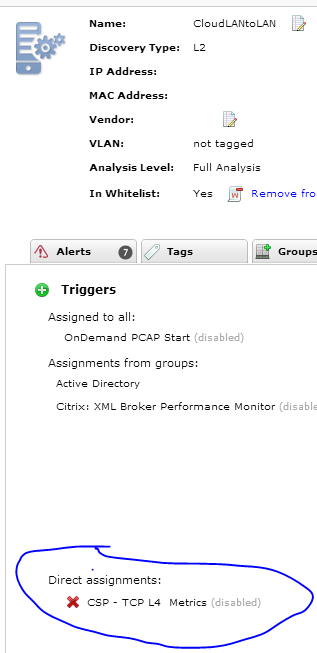
In this section I will review the process I used to create the dashboards above. It all starts off with a custom device group that will be the object the trigger is assigned to. Doing this allows us to store custom metrics. Our customer subnets are 10.Y.X/24. Our subnet for shared services is 10.y.x/24. We called our custom group CloudLANTOLAN. Effectively this definition should trigger on all flows in our Cloud as we don’t have subnets outside this range.

Once you have the custom device in place need to create and assign the trigger.
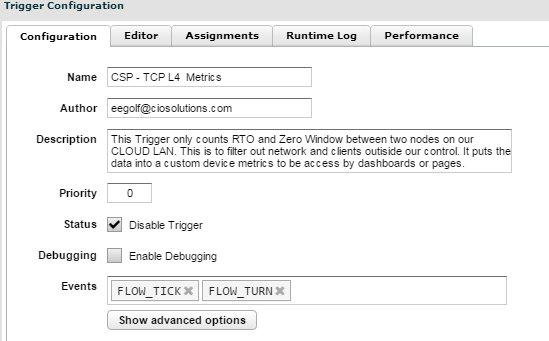
But before you assign the trigger you have to create the trigger. See below for configuration and code. We called our trigger CSP – TCP L4 Metrics. You want to be careful in creating triggers because they use valuable resources.
/*————————————————————
Author: Eric Egolf
Date: 5/22/16
Purpose: This trigger collects metrics in a manner that aligns with the needs of a multi tenent environment.
It uses a device to store custom metrics for use in dashboards and custom pages.
One of the main purposes is to filter out and only look at LAN 2 LAN Traffic.
By Filtering out non 10Gbs traffic we can get much more meaningful performance data regarding TCP L4 metrics such as zerowindow and RTO
————————————————————*/
//Variable that represents the customer
var customerDeviceID = “~CloudLANtoLAN–”
if((isLAN2LAN())) {
//Setup Variables for use in rest of script
myDevice = new Device(customerDeviceID);
var clientIP = Flow.client.ipaddr;
var serverIP = Flow.server.ipaddr;
var clientIP = String(clientIP);
var serverIP = String(serverIP);
var serverName = Flow.server.device.dnsNames
var clientName = Flow.client.device.dnsNames
var clientNameAbbr = getClientName(clientIP);
var serverNameAbbr = getClientName(serverIP);
var customerName = getCustomerBucket(clientNameAbbr,serverNameAbbr);
var Protocol = Flow.l7proto
/*——————————————————————–
FLOW EVENTS
———————————————————————-*/
if(event===”FLOW_TICK” | event=== “FLOW_TURN”) {
//Calculates to put in Device Metrics
var ZeroWndIn = Flow.client.zeroWnd
var ZeroWndOut = Flow.server.zeroWnd
var RTOIn = Flow.client.rto
var RTOOut = Flow.server.rto
var rcvWndIn = Flow.client.rcvWndThrottle
var rcvWndOut = Flow.server.rcvWndThrottle
var RTT = Flow.roundTripTime
var conversationBytes = Flow.bytes1 + Flow.bytes2
//We exclude this for RTT
var isMSRPC = (Protocol.toString() == “MSRPC”)
/*————————————————————–
RTT METRICS
—————————————————————*/
//calculate number of times zero window and keep track by client
if(ZeroWndIn > 0 || ZeroWndOut > 0) {
var key = customerName
myDevice.metricAddCount(“ZeroWnd_By_Customer_Cnt”,1);
myDevice.metricAddDetailCount(“ZeroWnd_By_Customer_Cnt_Detail”,key, 1);
var key = Protocol + “: ” + clientNameAbbr +” -“+clientIP+”->”+serverNameAbbr +”-“+ serverIP;
myDevice.metricAddCount(“ZeroWnd_By_Customer_By_Conversation_Cnt”,1);
myDevice.metricAddDetailCount(“ZeroWnd_By_Customer_By_Conversation_Cnt_Detail”,key, 1);
}
//calculate number of times RTO and keep track by client
if(RTOIn > 0 || RTOOut > 0) {
var key = customerName
myDevice.metricAddCount(“RTO_By_Customer_Cnt”,1);
myDevice.metricAddDetailCount(“RTO_By_Customer_Cnt_Detail”,key, 1);
var key = Protocol + “: ” + clientNameAbbr +” -“+clientIP+”->”+serverNameAbbr +”-“+ serverIP;
myDevice.metricAddCount(“RTO_By_Customer_By_Conversation_Cnt”,1);
myDevice.metricAddDetailCount(“RTO_By_Customer_By_Conversation_Cnt_Detail”,key, 1);
}
//calculate number of times recieve window throttle and keep track by client
if(rcvWndIn > 0 || rcvWndOut > 0) {
var key = customerName
myDevice.metricAddCount(“rcvWndThrottle_By_Customer_Cnt”,1);
myDevice.metricAddDetailCount(“rcvWndThrottle_By_Customer_Cnt_Detail”,key, 1);
var key = Protocol + “: ” + clientNameAbbr +” -“+clientIP+”->”+serverNameAbbr +”-“+ serverIP;
myDevice.metricAddCount(“rcvWndThrottle_By_Customer_By_Conversation_Cnt”,1);
myDevice.metricAddDetailCount(“rcvWndThrottle_By_Customer_By_Conversation_Cnt_Detail”,key, 1);
}
}
ADVISE ON TRIGGERS – WHAT DO I WISH I KNEW BEFORE STARTING
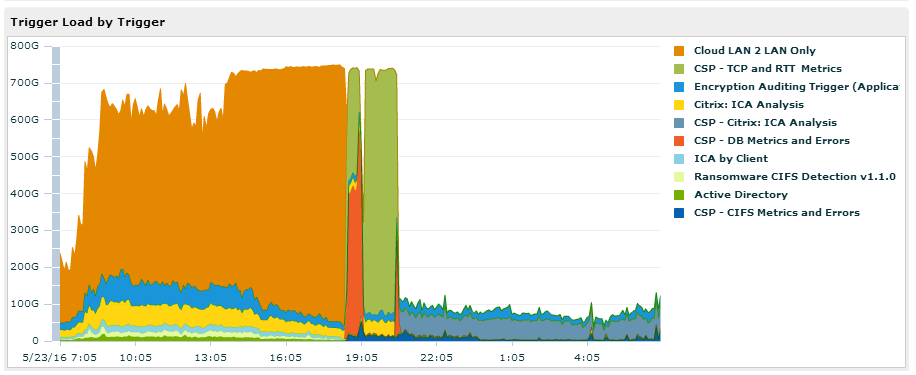
In my experience the FLOW TICK and FLOW TURN events are particularly resource intensive because they fire the most frequently. I am sure that there is a more technical answer than that but I lack the vocabulary to explain it. You can always look at the system heath to get info on Trigger Load and Trigger Load by Trigger. In this screenshot you can see the load reduce after adjustments are made.

To Write Good Triggers you need six things
- Understand the AddMetrics functions as part of the Device Class.
- Understand JavaScript
- Understand the Event Classes which are documented in the Trigger API on the ExtraHop website.
- Understand the properties available to each Event Class
- Understand when you need to use the Event Class Request and store its values for the Event Class Response vs when you can just use the event Class Response.
- Be able to create good a Test Key either in either a “Test” Custom Metric or the debugger. You should always to do this to validate the values a given property gives you is what you expect. You will find that not all properties give you what you are anticipating.
- An understanding that as you get good at the list above that no ExtraHop experts, i.e. your peers, will not catch up with your new advanced knowledge of protocols. I found that after learning ExtraHop at a trigger level and using this knowledge to create custom triggers my knowledge of what is actually happening on the wire increased 10 fold and was given a new vocabulary that others couldn’t grasp related to the most common Protocols. Said another way, Creating triggers will fill GAPS in your understanding of Protocols and in general make you a better troubleshooter, however it can be natural to try to simply expose this level of data to your team…big mistake. You need dashboards to follow KISS and then do advanced level analysis at other areas in the ExtraHop system.
Dashboards and Pages
Pages can link to Top Level metrics that then provide a link to detailed metrics. You need to understand this concept of Top Level Metrics vs Detailed metrics because it is very important in your ExtraHop journey. I found that I liked to create two sets of Metrics for any one thing I am measuring, i.e. a top level metric and a detailed level metric. For example
- Top Level – I want a simple count of Zero Windows going on in between servers on my LAN. To do this I use a Top Level metric that doesn’t do anything with the customer. Counting is typically either a “++” type operation or counting bandwidth type operation where you are adding Bytes. There are other Metrics besides count, such as datasets and samplesets that can be used. Notice that the top level metric doesn’t allow me any visibility by customer.
- Detailed – Now I want to Pivot on customer so I use this variable as the key. This is the detailed Metric.
- But wait there is more – I also want to have some more information than just customer, so I create a key by conversation. This helps pinpoint the issue and keeps the key from being overly unique. The exact key depends on your needs and the actual protocol but typically it is some combination of Customer Name, Source IP, Destination IP, Values | Records | Errors.
Below is a real simple example of the top level metric and detailed level metric. Top Level is in Green and Detailed is in Blue
var key = customerName
myDevice.metricAddCount(“ZeroWnd_By_Customer_Cnt”,1);
myDevice.metricAddDetailCount(“ZeroWnd_By_Customer_Cnt_Detail”,key, 1);
var key = Protocol + “: ” + clientNameAbbr +” -“+clientIP+”->”+serverNameAbbr +”-“+ serverIP;
myDevice.metricAddCount(“ZeroWnd_By_Customer_By_Conversation_Cnt”,1);
myDevice.metricAddDetailCount(“ZeroWnd_By_Customer_By_Conversation_Cnt_Detail”,key,1)
DNS CSP Multi Tenant Dashboard
We followed a similar model for our DNS dashboards. We basically have errors where we list errors by customer and then provide a detailed view of the errors, i.e. which customer and IP made the DNS request along with what the Record was that caused the error. The Trigger was also created with a filter that allowed us to filter out Errors we don’t want to see, for example WPAD errors. This is an important point. You will have things in your environment that are normal yet cloud your dashboards and metrics. I found the best way to handle this is filters in the JavaScript, usually using an array of blacklisted strings. You need the blacklist to specify if it is for Records, IP Addresses, Etc. In addition to some errors in some protocols just aren’t important, I’m taking to you CIFS.
We did the same thing for successful DNS requests. You can see the screenshot for the Dashboard that has DNS Errors and Success by Customer.

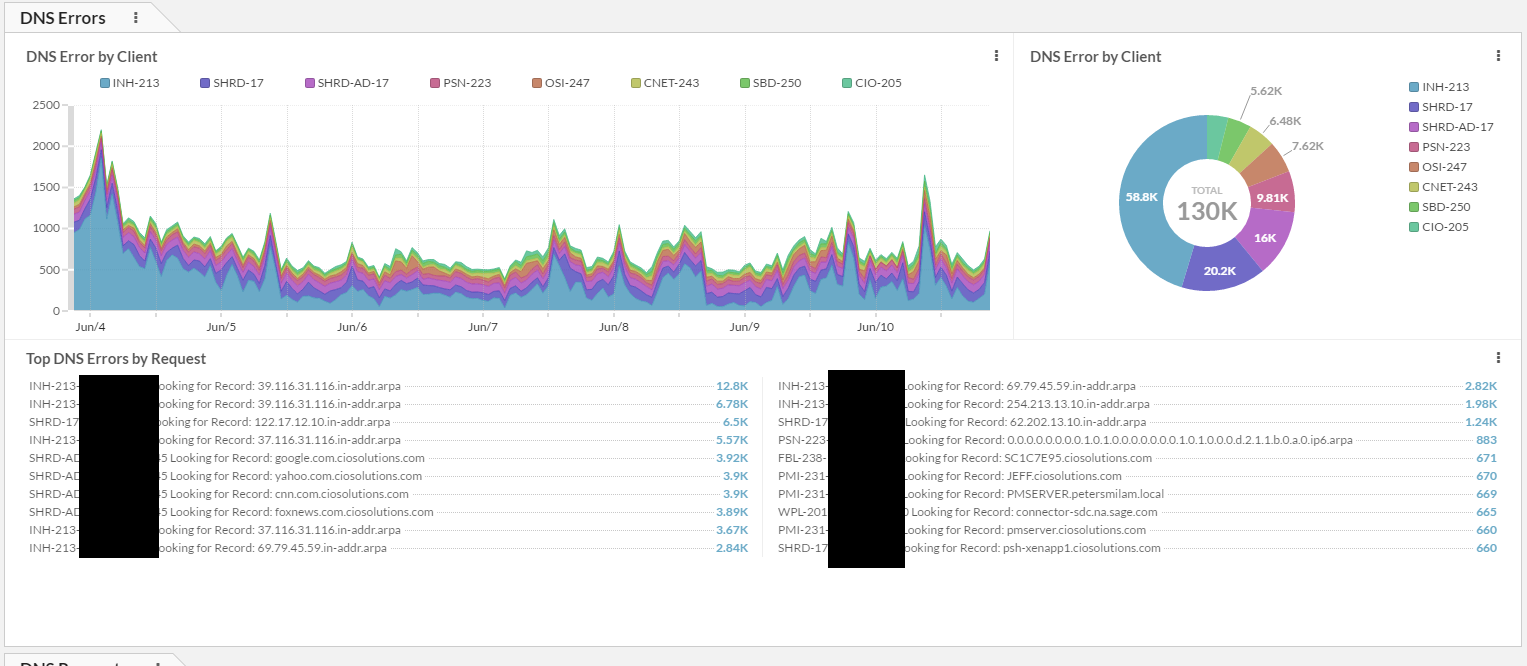
The code for the CSP – DNS Trigger is below.
/*————————————————————
Author: Eric Egolf
Date: 5/22/16
Purpose:
————————————————————*/
//Variable that represents the customer
var customerDeviceID = “~CloudLANtoLAN–”
//White and Black Lists
//Setup Variables for use in rest of script
myDevice = new Device(customerDeviceID);
var clientIP = Flow.client.ipaddr;
var serverIP = Flow.server.ipaddr;
var clientIP = String(clientIP);
var serverIP = String(serverIP);
var serverName = Flow.server.device.dnsNames
var clientName = Flow.client.device.dnsNames
var clientNameAbbr = getClientName(clientIP);
var serverNameAbbr = getClientName(serverIP);
var customerName = getCustomerBucket(clientNameAbbr,serverNameAbbr);
var Protocol = Flow.l7proto
if((isLAN2LAN())) {
/*——————————————————————–
DNS Metrics
———————————————————-*/
if(event===”DNS_RESPONSE”) {
if(DNS.error && isLAN2LAN() && (!DNS.qname.match(“wpad”))){
var key = clientNameAbbr
myDevice.metricAddCount(“DNS_Error_By_Client_Cnt”,1);
myDevice.metricAddDetailCount(“DNS_Error_By_Client_Cnt_Detail”,key, 1);
var key = clientNameAbbr+”-“+clientIP+” Looking for Record: “+DNS.qname
myDevice.metricAddCount(“DNS_Error_By_Client_By_Error”,1);
myDevice.metricAddDetailCount(“DNS_Error_By_Client_By_Error_Detail”,key, 1);
//debug(“DNS ERROR “+ key2);
}
else if(isLAN2LAN()){
//Count Queries Per Customer
var key = clientNameAbbr
myDevice.metricAddCount(“DNS_Query_By_Client_Cnt”,1);
myDevice.metricAddDetailCount(“DNS_Query_By_Client_Cnt_Detail”,key, 1);
var key = clientNameAbbr+”-FROM:”+clientIP+” Record:”+DNS.qname
myDevice.metricAddCount(“DNS_Query_By_Client_By_Record_Cnt”,1);
myDevice.metricAddDetailCount(“DNS_Query_By_Client_By_Record_Cnt_Detail”,key, 1);
//debug(“DNS SUCCESS “+ key2);
}
}
}//end if isLAN2LAN()
Other Dashboards
We basically do this same model for Active Directory, CIFS, Database and Citrix. If I get requests or positive results from this post I will create a part 2 that explains how these are made but at this point this post has taken me longer than expected. Happy to provide more but only if we find interest.
Helper Functions with ExtraHop
At the time of this writing ExtraHop doesn’t have a function library you can create. So we created a trigger that is disabled that has all our functions and we need to cut and past into our other triggers if we update a function. Kind of sucks but it was the only way we could think of. I provided some examples of these functions below.
/*——————————————
FUNCTION getClientName
————————————*/
function getClientName (ipaddress)
{
// Handle empty [SUBNET]
if (! ipaddress) {return ‘Unknown ipaddress’}
//Figure out Client VLAN
var Client2 = ipaddress.toString();
var pos1=Client2.indexOf(“.”);
var lpos=Client2.lastIndexOf(“.”);
var temp=Client2.slice(pos1+1,lpos)
var pos2=temp.indexOf(“.”);
var temp2=temp.slice(pos2+1,pos2+4);
var clientVLANID = temp2
var clientName = “Unknown” //start off unknown
//Determine Client Name
switch(clientVLANID){
case “17”: clientName = “SHRD”;break;
case “200”: clientName = “BSB”;break;
case “201”: clientName = “WPL”;break;
case “202”: clientName = “SHRD-DMZ”;break;
case “203”: clientName = “RAD”;break;
}
//debug(“CLient Name ” + clientName+”-“+clientVLANID+”-“+ipaddress)
if(clientName.match(/SHRD/g)){
switch(ipaddress.toString()){
case “10.x.x.x”: clientName = “SHRD-AD”;break;
}
}
clientName=clientName+”-“+clientVLANID
return clientName;
}
/*——————————————
FUNCTION isLAN2LAN
————————————*/
function isLAN2LAN (){
var svrSubnet = “10.x.x.x”;
var svrSubnetmask = x;
var svrSubnet2 = “10.x.x.x”;
var svrSubnetmask2 = x;
if(((Flow.client.ipaddr.mask(svrSubnetmask) == svrSubnet) &&
(Flow.server.ipaddr.mask(svrSubnetmask) == svrSubnet)) ||
((Flow.client.ipaddr.mask(svrSubnetmask2) == svrSubnet2) &&
(Flow.server.ipaddr.mask(svrSubnetmask) == svrSubnet)) ||
((Flow.client.ipaddr.mask(svrSubnetmask) == svrSubnet) &&
(Flow.server.ipaddr.mask(svrSubnetmask2) == svrSubnet2)) ||
((Flow.client.ipaddr.mask(svrSubnetmask2) == svrSubnet2) &&
(Flow.server.ipaddr.mask(svrSubnetmask2) == svrSubnet2))){
return 1
}
else{
return 0;
}
}
/*——————————————
FUNCTION getCustomerBucket
————————————*/
function getCustomerBucket (clientN,serverN)
{
if(clientN === serverN){
customer=clientN;
}
else if((clientN.match(/SHRD/g)) && (serverN.match(/SHRD/g)) ){
customer=’SHRD’;
}
else if(clientN.match(/SHRD/g)){
customer=serverN;
}
else if(serverN.match(/SHRD/g)){
customer=clientN;
}
else{
customer=”unknown”;
}
//debug(customer + “=” +clientN+”+”+serverN)
return customer;
}
