I started the process of evaluating ExtraHop’s wire data monitoring technology very excited about the possibilities and my optimism still holds after a few days. I am looking forward to diving even deeper into the technology and spending some time understanding the additional business related benefits it can provide to our customers. My personal philosophy is that monitoring tools should be look at cautiously as more data doesn’t always lead to an efficient operations and deeper insights doesn’t always mean valuable insights… BUT even at this early stage in evaluation I think its safe to say the deep(multi layer) insights provided by extra hop are both valuable and unique.
The wanted to write this article to make more technical information available on a topic in which, outside of marketing literature and people testing it in lab environments, their isn’t much available on the web. In addition I wanted to describe the configuration of the VDS(Virtual Distributed Switches) that vmware uses to send the ExtraHop virtual machine the data it requires. In my exploration of this technology I found that documentation of how to configure the VDS to send wire data to Extra Hop in a pure virtual environment, using HP Blade System and Virtual Connect IO Modules, to be lacking.
Background
Overall we have found that the data provided by Extra Hop is much deeper than any other monitoring tools available. After about an hour with the tool my impression was that it provided the insights that I had always wanted wireshark or other packet capturing tools to provide…but as you get to know Extra Hop you find out that it goes much deeper than this.
One thing to note is that you can’t compare Extra Hop to other monitoring tools because most other tools are based on an “SNMP/API/Agent” model or whereas Extra Hop is based on a “Wire Data” model. The SNMP/API based approach requires
- You to manually enter the devices you want to monitor and requires those devices to have an IP address.
- You or your Monitoring vendor to know which data is important about the device, i.e. you can only monitor something that you explicitly want to monitor.
- What thresholds are important for each counter you want to monitor.
- Selectively turn on/off counters and modify thresholds.
ExtraHop removes a lot of these requirements which tend to be error prone. In addition it can monitor things not able to be monitored by SNMP/API either because the specific implementation of a SNMP/API counter doesn’t exist or the nature of SNMP/API doesn’t allow it. This concept of SNMP/API model being different than Extra Hop seems simple but there is a huge subtly that many miss. The concept is that even if the SNMP/API supports a counter the nature of the model makes it impossible to slice/dice the data in a meaningful way. Lets take the example of “SQL transaction count per sec” and assume my SNMP/API monitoring tools is getting an accurate value(a big assumption) for this counter. Lets even assume that I created a baseline threshold that alerts me when this counter goes above the threshold(another big assumption because in my experience most people don’t take the time to do this with SNMP/API monitoring tools). Once I get this alert I look at my SNMP/API monitoring tool and find out that my DB server is reporting 4 times more SQL transactions per second than normal…great visibility…but the next logical troubleshooting step…which is determining the specific source(s) of this increase is impossible with an SNMP/API monitoring tool. Without ExtraHop, I would need to pretend I am a MSSQL\Oracle Expert and try to determine the source of the increase. However, with Extra Hop, my monitoring tool helps me dive deeper. The alternative of being an expert on all possible database systems to figure out what is happening is not practical but it is situation most monitoring tools put you in.
It is this ability to slice and dice that high level monitoring data makes ExtraHop refer to itself as Big Data and Monitoring combined and gives it a unique ability compared to other solutions on the market.
If a traditional API/SNMP monitoring tool is a flat excel spreadsheet with 10 rows of summarized data then Extra Hop is an excel pivot table that can give you the same 10 rows report but actually has thousands of rows available to slice and dice in different ways. Those who understand the power of pivot tables on raw transactional data never go back. The same is true with Extra Hop.
I use the term SNMP/API monitoring tools as a generalization of commericial products like; Solarwinds, Logicmonitor, NimSoft, Eginnovations, VMware Turbo, VeeamOne, Goliath Technologies and Science Logic. In the open source realm these tools includes products like; Nagios, Cacti, Incinga and Zabbix.
I only bring up these comparisons because it is what most people ask about but in my experience the comparison about what type of metrics ExtraHop provides vs traditional SNMP/API tools is the wrong question and misses the true value proposition. The real value proposition of the ExtraHop solution comes from getting the same metrics that SNMP/API tools get you BUT enables you to dive deep into the data to understand all the details surrounding that metric from L2 to L7. That is something that SNMP/API tools can’t do and is extremely useful for all functional units in the IT team; Network Operations Center, Security Operations Center, Tier 1, 2 and 3 Support.
The metrics that ExtraHop can provide that are above and beyond SNMP/API tools is also useful and I don’t want to marginalize it…. but I think focusing on it misses an important distinction.
There are other monitoring tools outside of SNMP/API. These tools are Flow Analyzers such as Scrutinizer, Agent Based Tools that can feed data to traditional SNMP/API systems, and Log Aggregators such as Splunk or Sumo Logic. These tools have their place in the monitoring world and are discussed in more detail as compared to ExtraHop at the bottom of this post.
VMware Configuration
Our deployment goal with ExtraHop was for everything to be virtual and minimize the need for special configuration of the physical ethernet switches(Juniper EX4300’s). Port mirroring is traditionally a network design issue and it turns out VMware’s VDS has similar functionality in software. We found that there are two basic models for configuring mirror, RSPAN and ERSPAN. VMWare’s VDS can support both models(see screenshot below that maps the each model to the DVS session types).
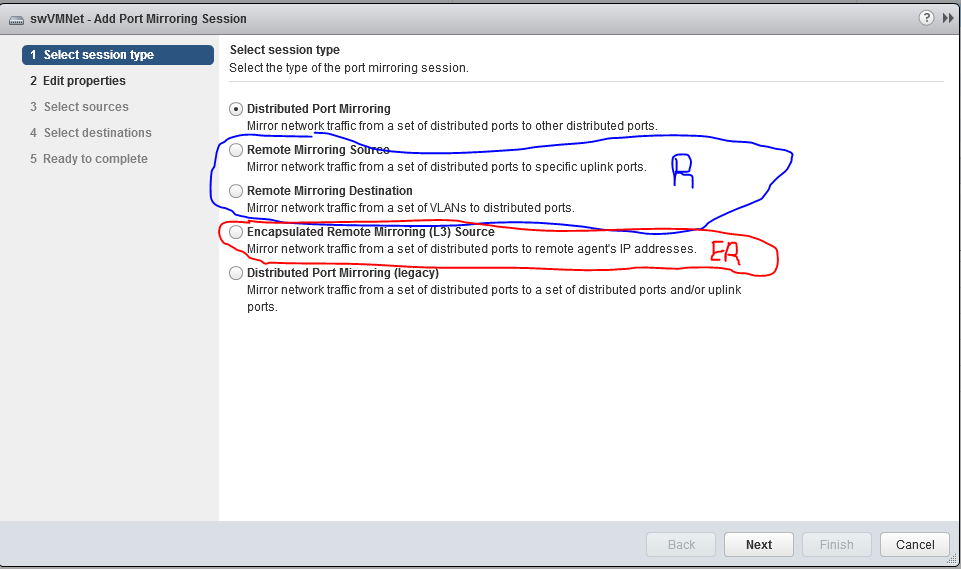
You can find some documentation on the topic of RSPAN vs ERSPAN in DVS on the web but my experience was those articles are 1 dimensional and do not sufficiently cover the topic so I will try to fill in some GAPS.
So lets start with RSPAN(Blue)…this model is only appropriate if you have a physically separate NIC on your host and that NIC is connected to an RSPAN capable Ethernet switch. The reason is that Ethernet frames will be forwarded out the physical NIC(SPAN OUT Port) without manipulating the MAC destination headers. If those frames hit a switch that has the RSPAN VLAN configure but isn’t setup as an RSPAN VLAN the switch doesn’t know where to forward the frames and will ether drop the traffic or forward them back out the same port they came in on. When we tried to use the RSPAN model with Virtual Connect(VC) in our blade system we found that the VMHosts were forwarding the mirror traffic out the SPAN OUT uplink correctly but once those frames hit the VC Fabric their was no way to know which blade bay had the Extra Hop VM on it and hence the VC didn’t know where to forward the frames to.
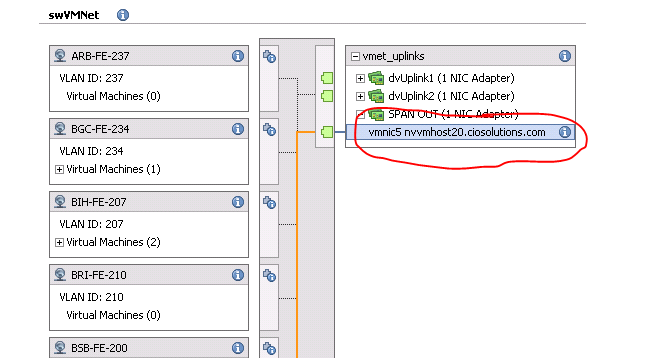
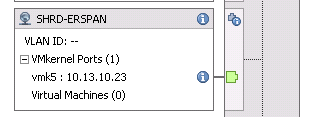
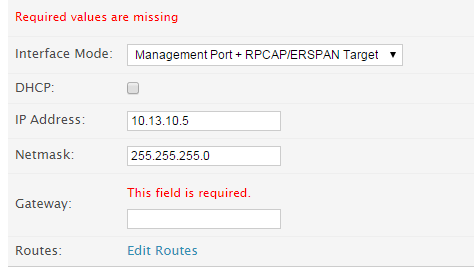
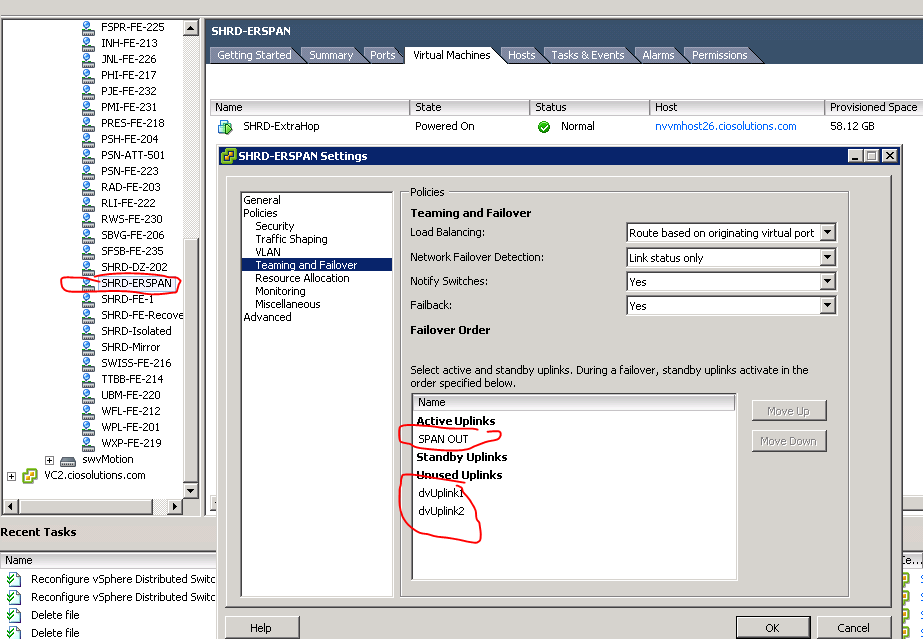
So we moved on to the ERSPAN model, which at the time of this writing, I believe to be the best model for most deployement scenarios. Here is how we configured ERSPAN. Each Blade was given a dedicated NIC…we used vmnic5. The same DVS that is used for our VM Guest traffic and Port Groups was given a 3rd uplink. The 3rd uplink was named SPAN OUT uplink. It is important than when you add the 3rd uplink you tell the DVS to make that uplink unavailable to all existing Port Groups before you add the physical vmnic5 to the uplink otherwise all the existing VM Guest port groups will start using that uplink as well as the other two that are already being used. Once the uplink is created you will want to create a new port group, we named ours SHRD-ERSPAN. This port group needs to be setup to only us the SPAN OUT Uplink and the other 2 existing uplinks should be set to unavailable. The second NIC on your Extra Hop VM will be attached to the SHRD-ERSPAN port group. In addition you will to set up the 2nd NIC in the Extra Hop GUI to be a “Management + ERSPAN” nic.
Once that is completed it is time to make sure each physical host gets configured correctly. You do this by going into each physical host and attached its vmnic5 to the ERSPAN Uplink as well as created a VMKernal port on the SHRD-ERSPAN Port Group. You will want the VMKernal port to have an IP address on the same subnet as the 2nd NIC of the Extra Hop Virtual Machine. I believe (although I haven’t confirmed) that in order for ERSPAN to work the DVS has to source the encapsulation packet from an IP address that has access to the ERSPAN Target(Extra Hop VM)….this means that if you don’t put a VMKernal port with an IP address on the DVS then the DVS will pick the IP of another VMKernal port which won’t have access to your SHRD-ERSPAN Port Group. In our case we also needed to configure the VC Fabric so that the port connected to Vmnic5 was a separate “vnet.”

Extra Hop Wire Data
Now on to the Extra Hop data. We used a production environment for our tests in order to ensure we would get real world data and real world insights. Our environment provides Hosted Desktops(Citrix), Hosted Email(Exchange), Databases, Active Directory, File Servers and Web servers. We figured this would be a good cross section of the type of applications and servers in a Microsoft Shop. I also think a lot of the lessons apply to non Microsoft shops, i.e. LAMP stack vs IIS w MSSQL is similar from a data on the wire perspective.
DNS with Extra Hop
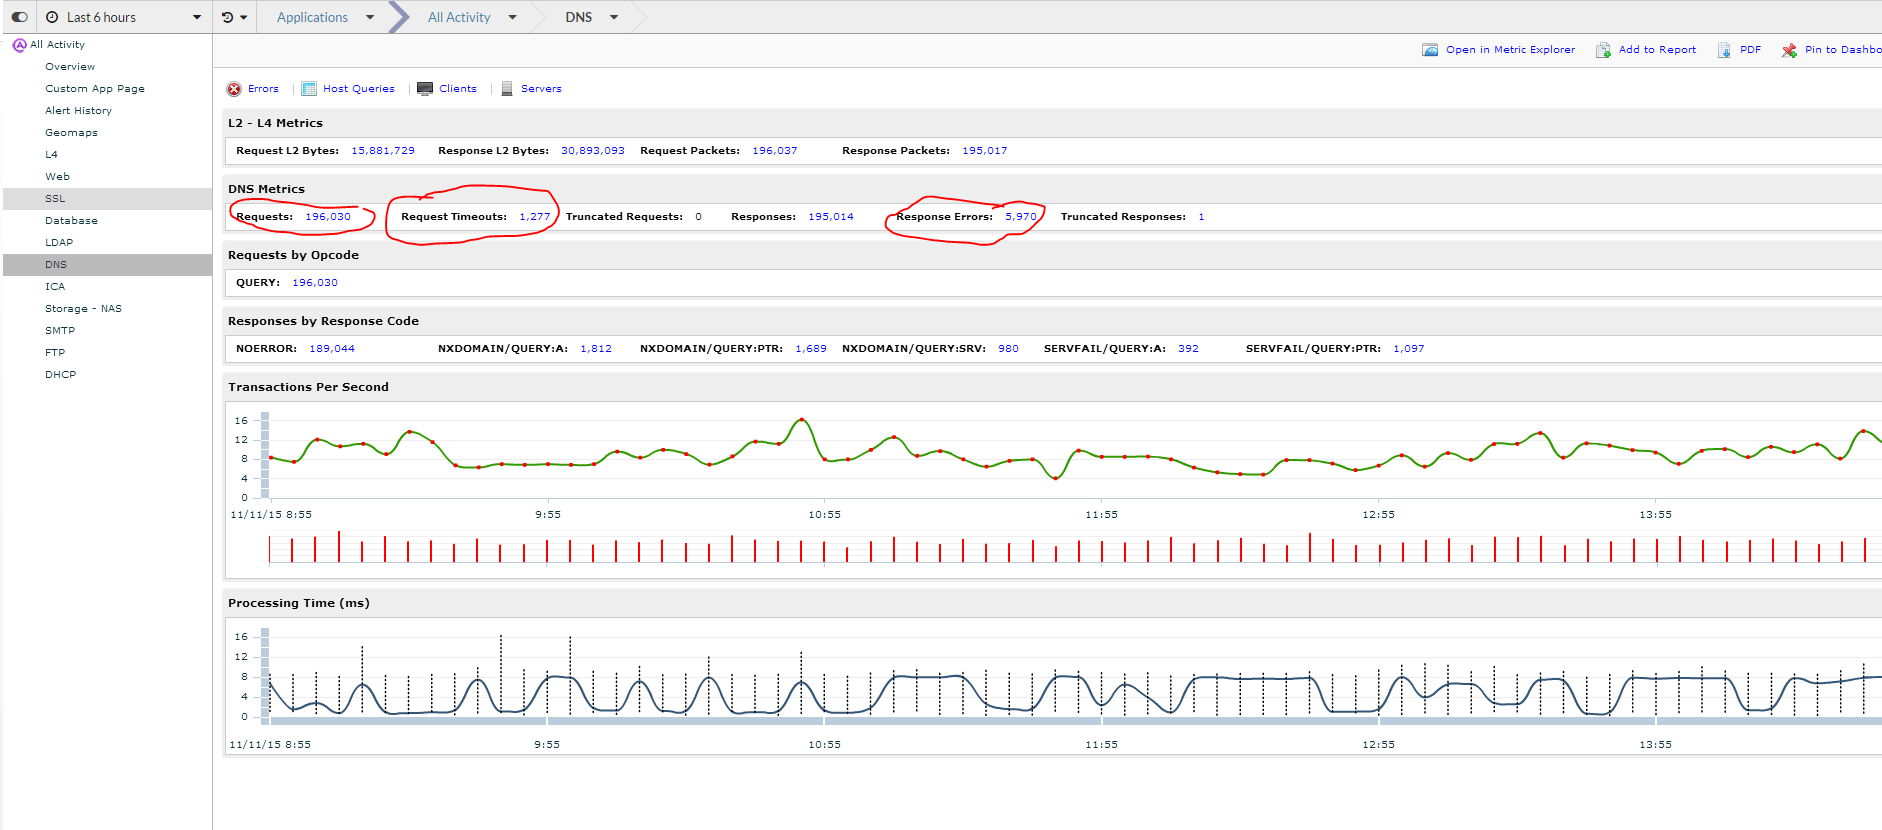
The first thing I noticed when looking at DNS is the number of requests, specifically the number of requests that timed out and the number of response errors. This can help establish the baseline for our environment(see screenshot below). But this data isn’t really interesting at the moment. I want to know if I have any issues and explore the data to get to know my environment better.
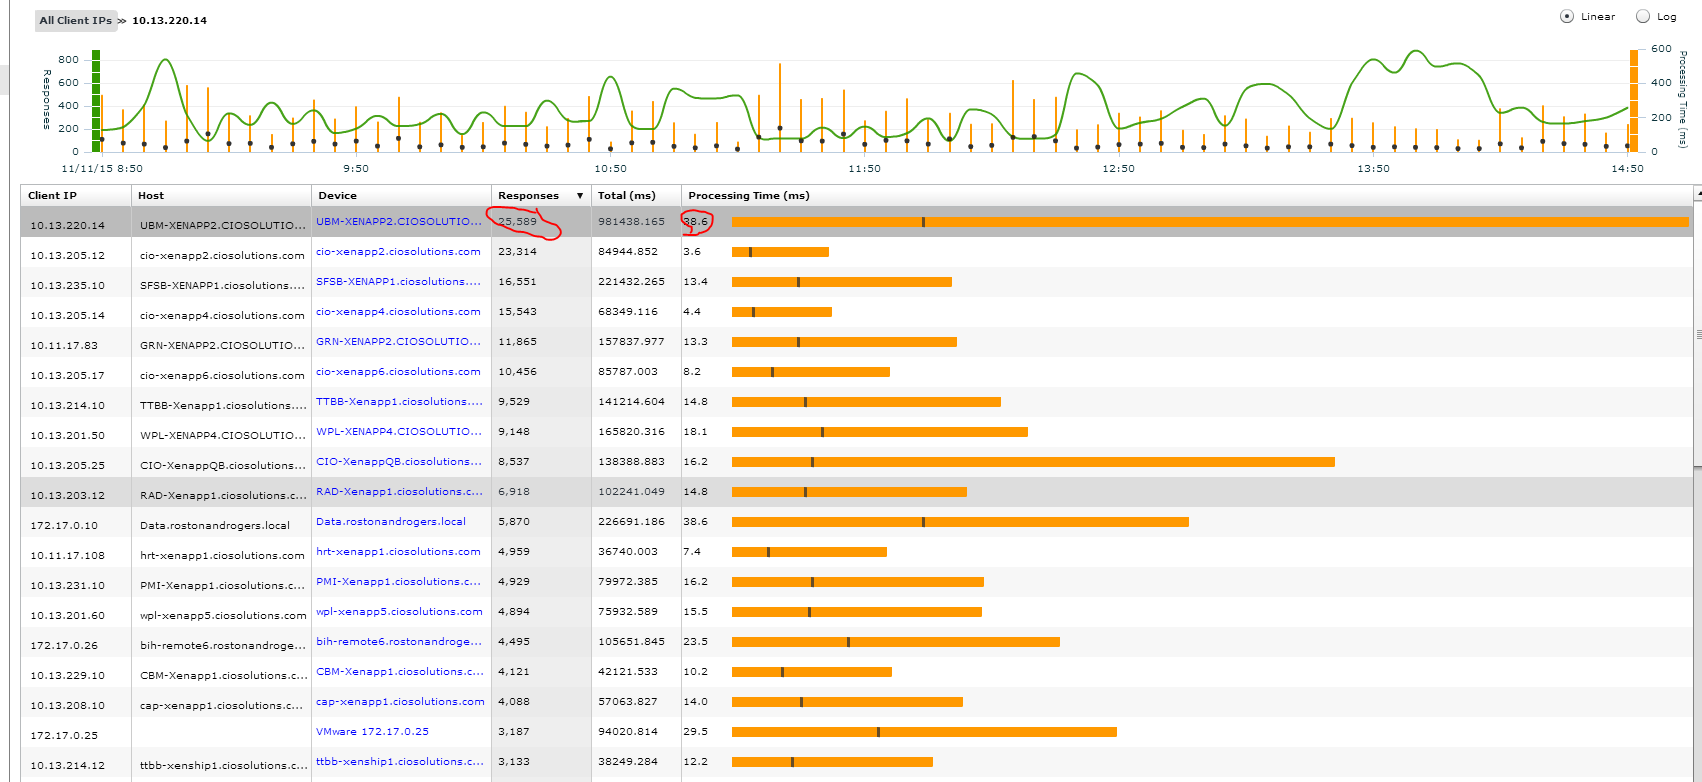
The first thing I do is click on client’s icon to understand who is making the DNS requests. I see that the top requestor made 25,589 DNS requests over the past 6 months. The other interesting fact is that this server had a much higher response time than other servers. Although the response time is still within reasonable thresholds it is interesting that it is taking so much longer. Lets dive deeper.
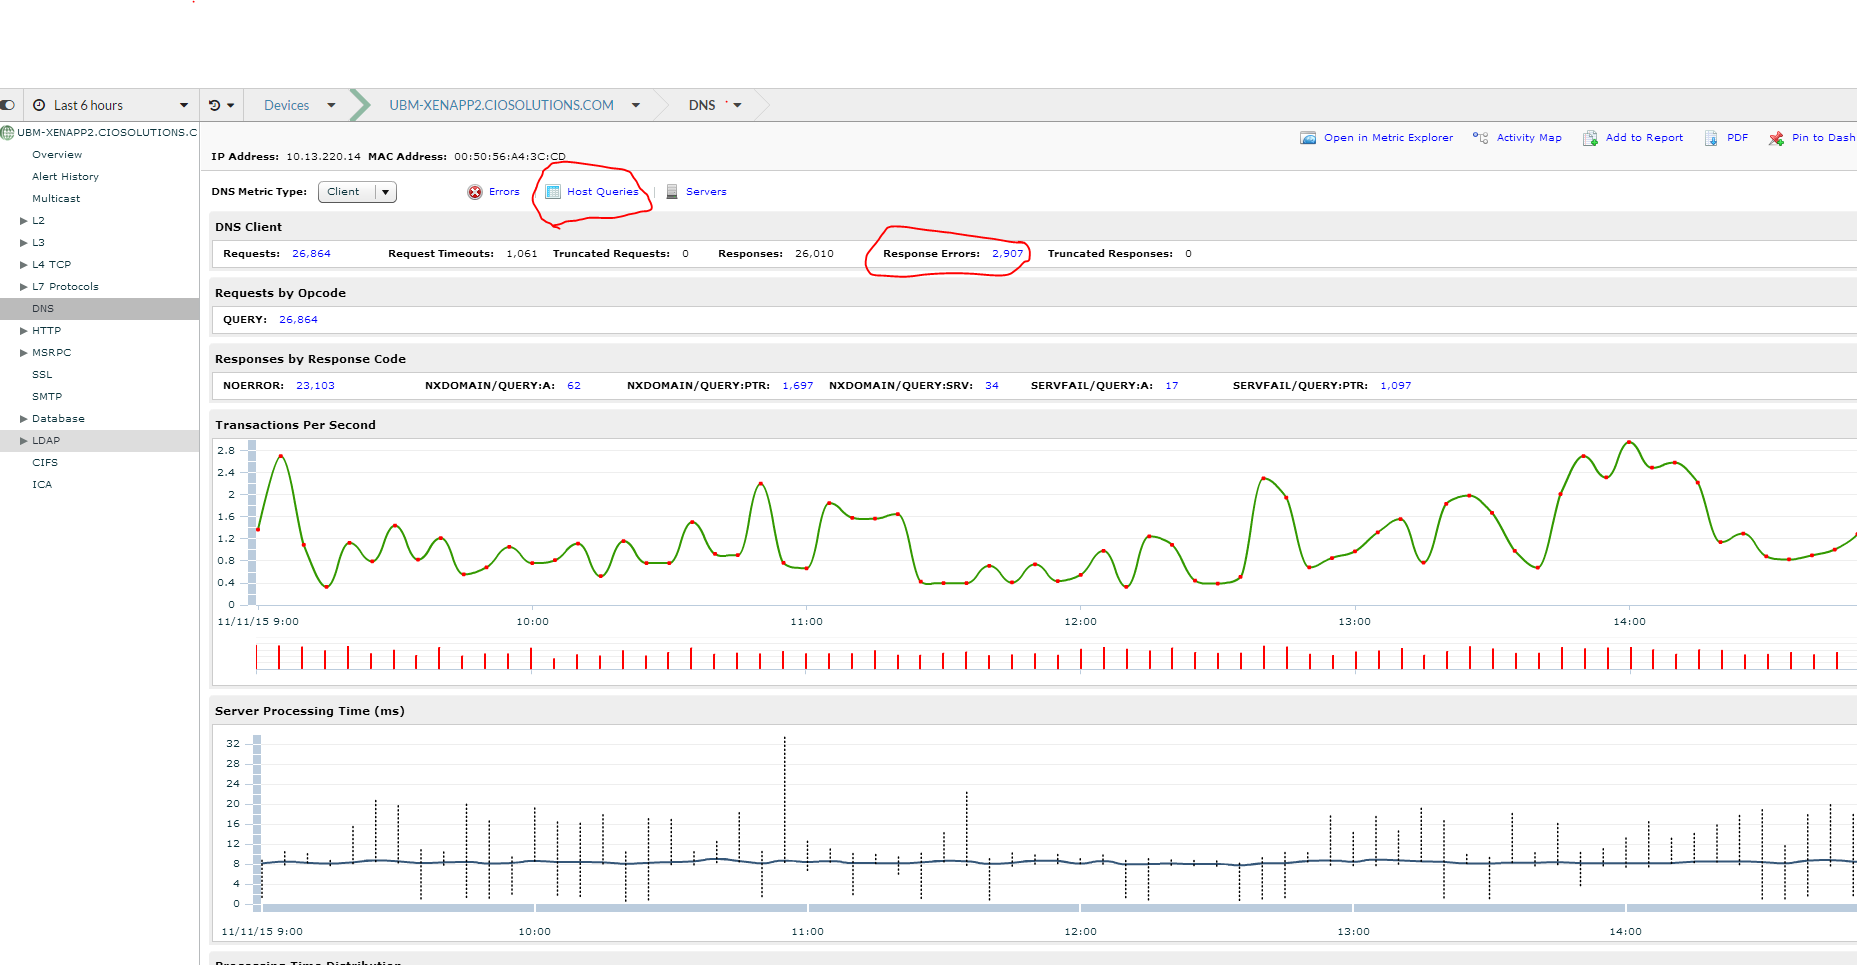
By clicking on the actual device I am able to bring up the DNS application for just this device. To understand more about this host as a DNS client I am going to look at the errors and the actual queries it is making.
I can see all the DNS queries this host is making and the ones that are generating errors. It looks like the server is looking for a PTR record for a particular IP address(205.154.111.224). This is likely a public IP address with no PTR record and if I wanted to correct it I could either find the application doing the look up or work with the ISP on adding the right record. In this case I am going to leave it as I don’t believe it to be a major issue.
The other thing I notice is lots of facebook requests. Shoot…someone forgot to turn the URL filter on the Firewall. This is probably why this host has a much higher DNS count than most other servers… it the second highest server was also a Citrix Xenapp server and might also not have URL filtering working correctly.
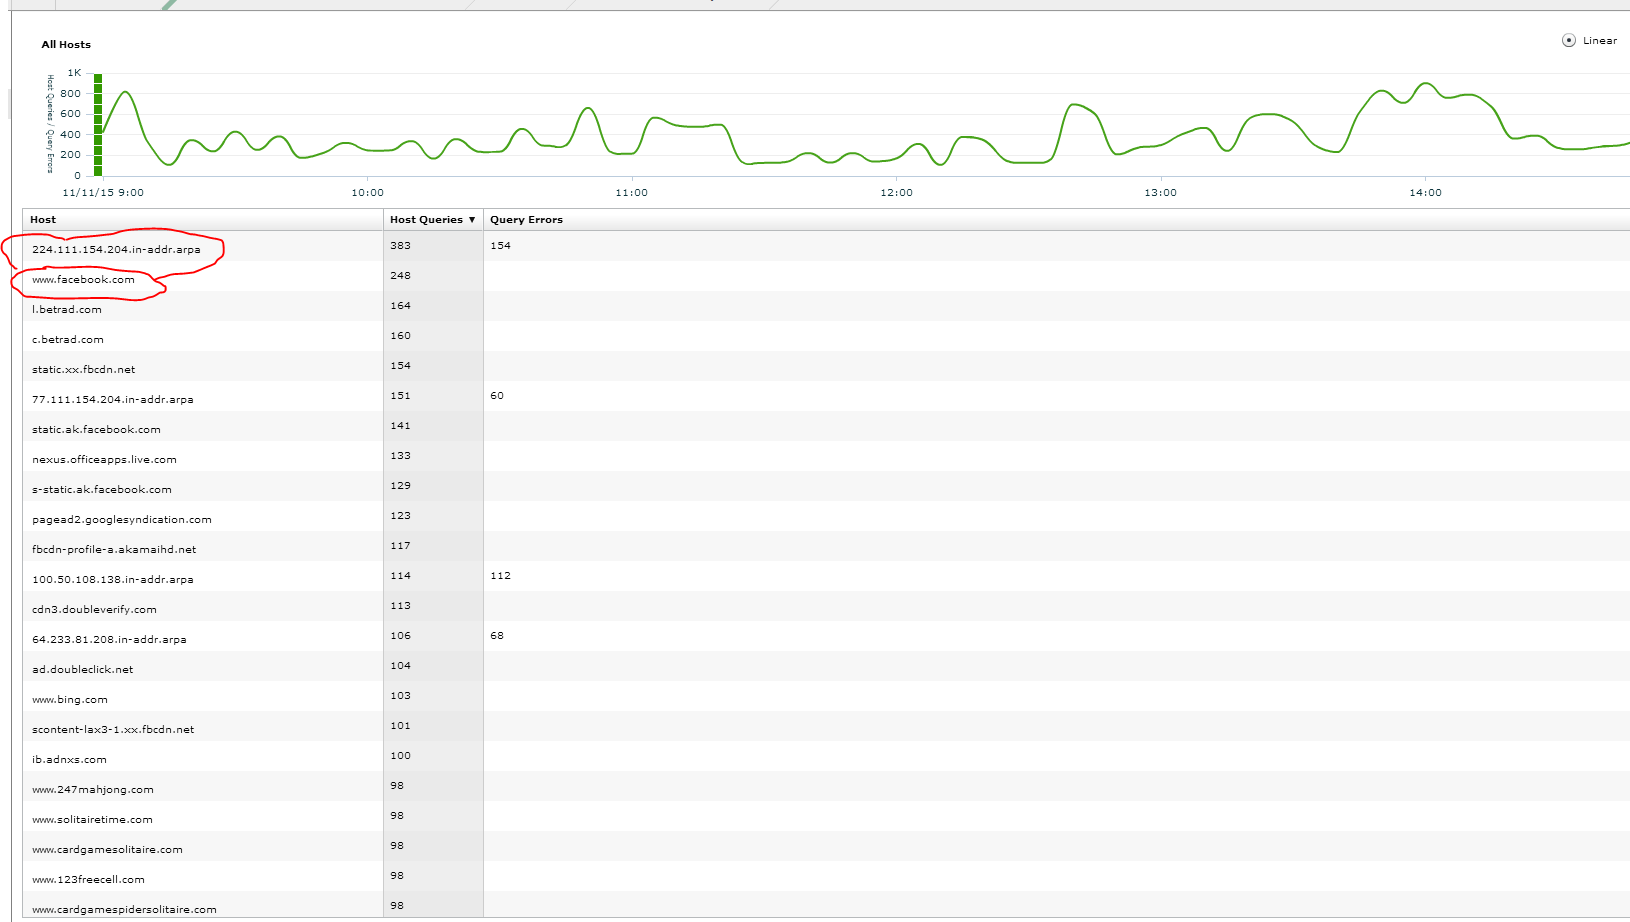
Keep in mind with this DNS example we went from dns app to dns clients to specific server to dns queries and errors. We could have go in many other directions as the situation required, i.e. I could have explored DNS servers and looked for anomalies and issues on the DNS server end as well.
Databases, specifically MS SQL with ExtraHop
Lets take a look at databases. Since I haven’t created specific groups create for my servers I am going to start at the container that has all databases and explorer. Within all databases I want to determine if I have any servers that are taking a long time to process queries. I do this by clicking the process time. ***Before show you the next steps I want to make a point*** The one challenge with wire data is that if it doesn’t hit the wire then ExtraHop can’t see it. This is important when you have database and web servers located on the box. If the call from the web/app server doesn’t go across the wire to the database server then extrahop will not see it. This is important to because if I have a crappy mixed db/app then I won’t see performance issues. I suspect this isn’t a big deal because if your app isn’t designed in a two tier model than it probably isn’t a complex enough server to need this deep of database monitoring.
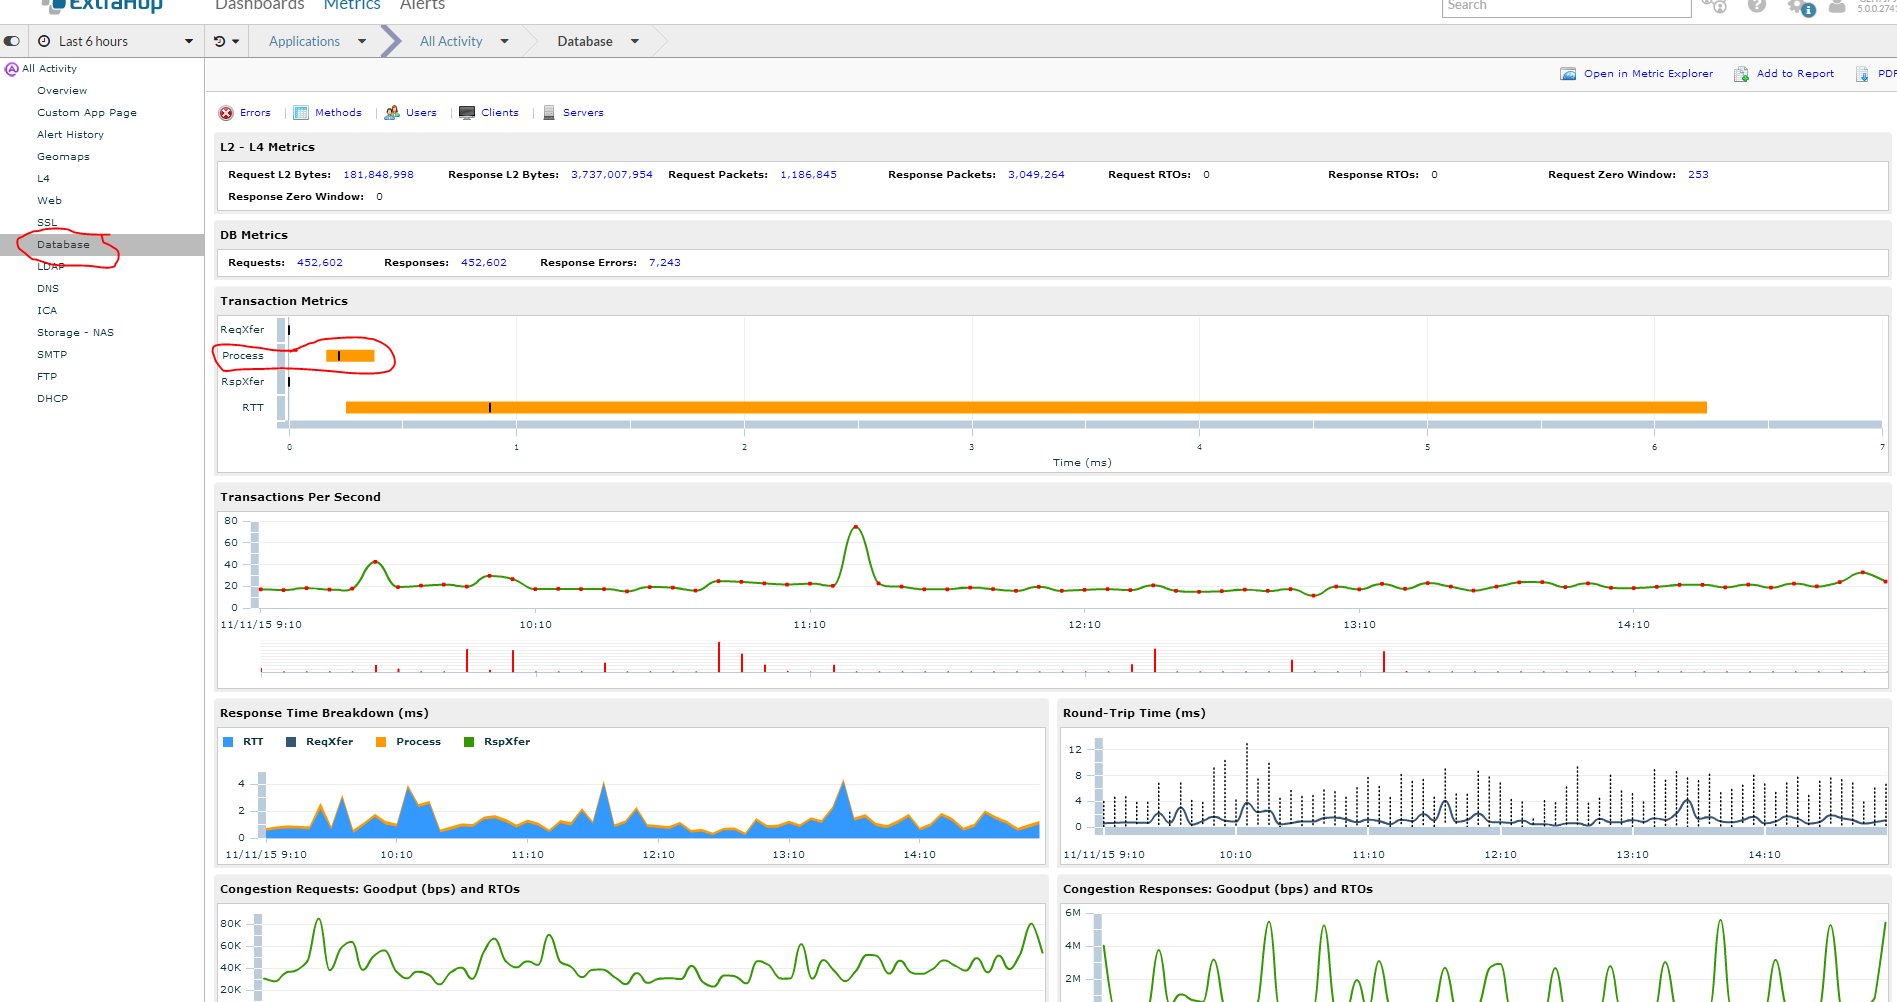
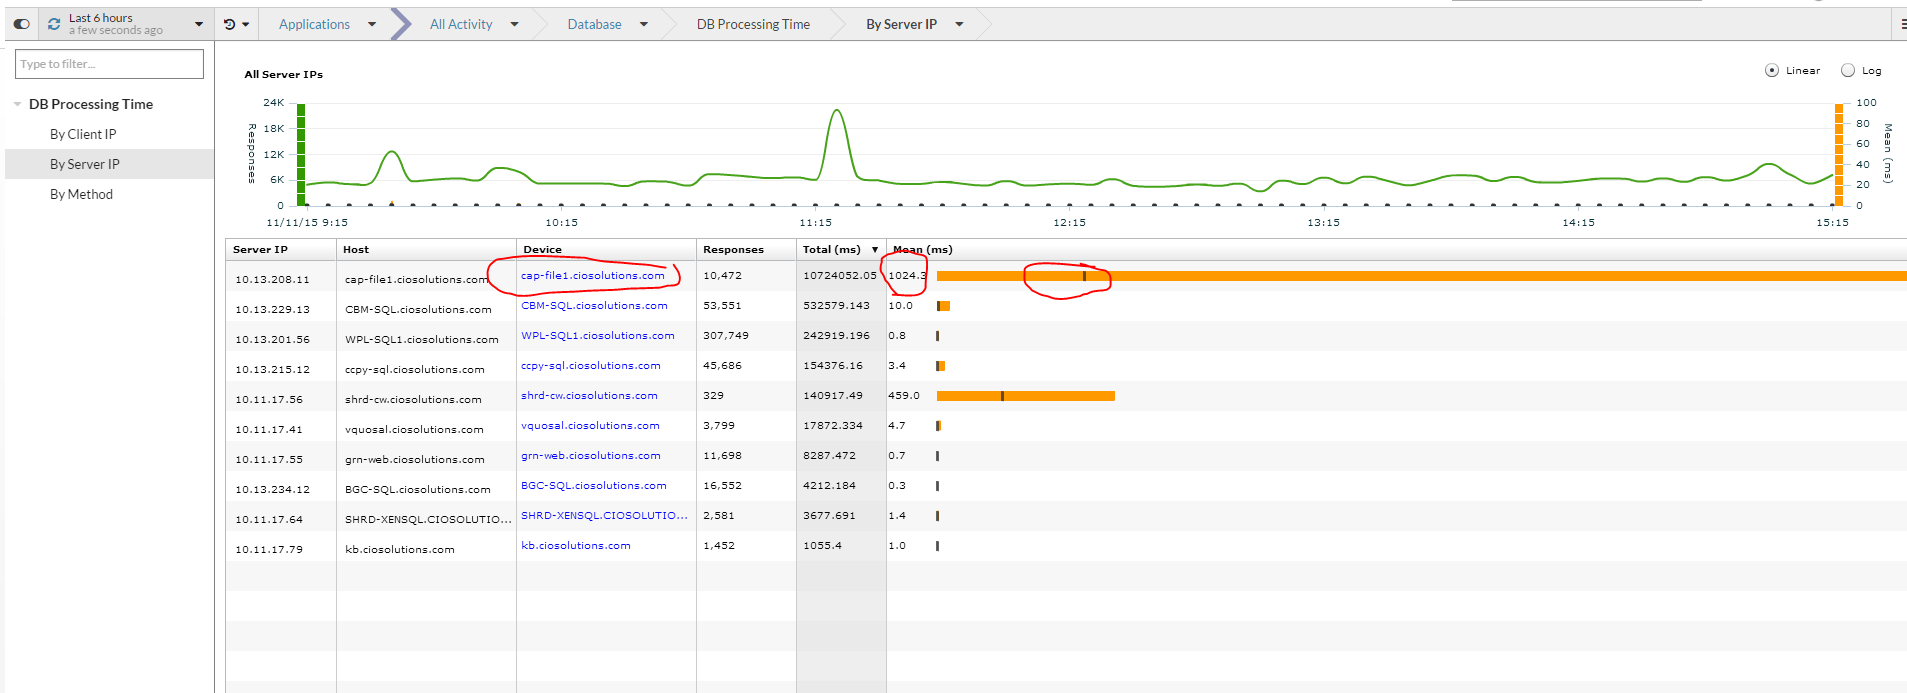
Wow I can see two of my database servers that have extremely long processing time compared to everything else. However processing time isn’t as important as mean processing time which is represented by the little black graph. I am going to look at the highest and dig deeper.
By highlighting the specific host I can see the history of requests and processing time for this host.
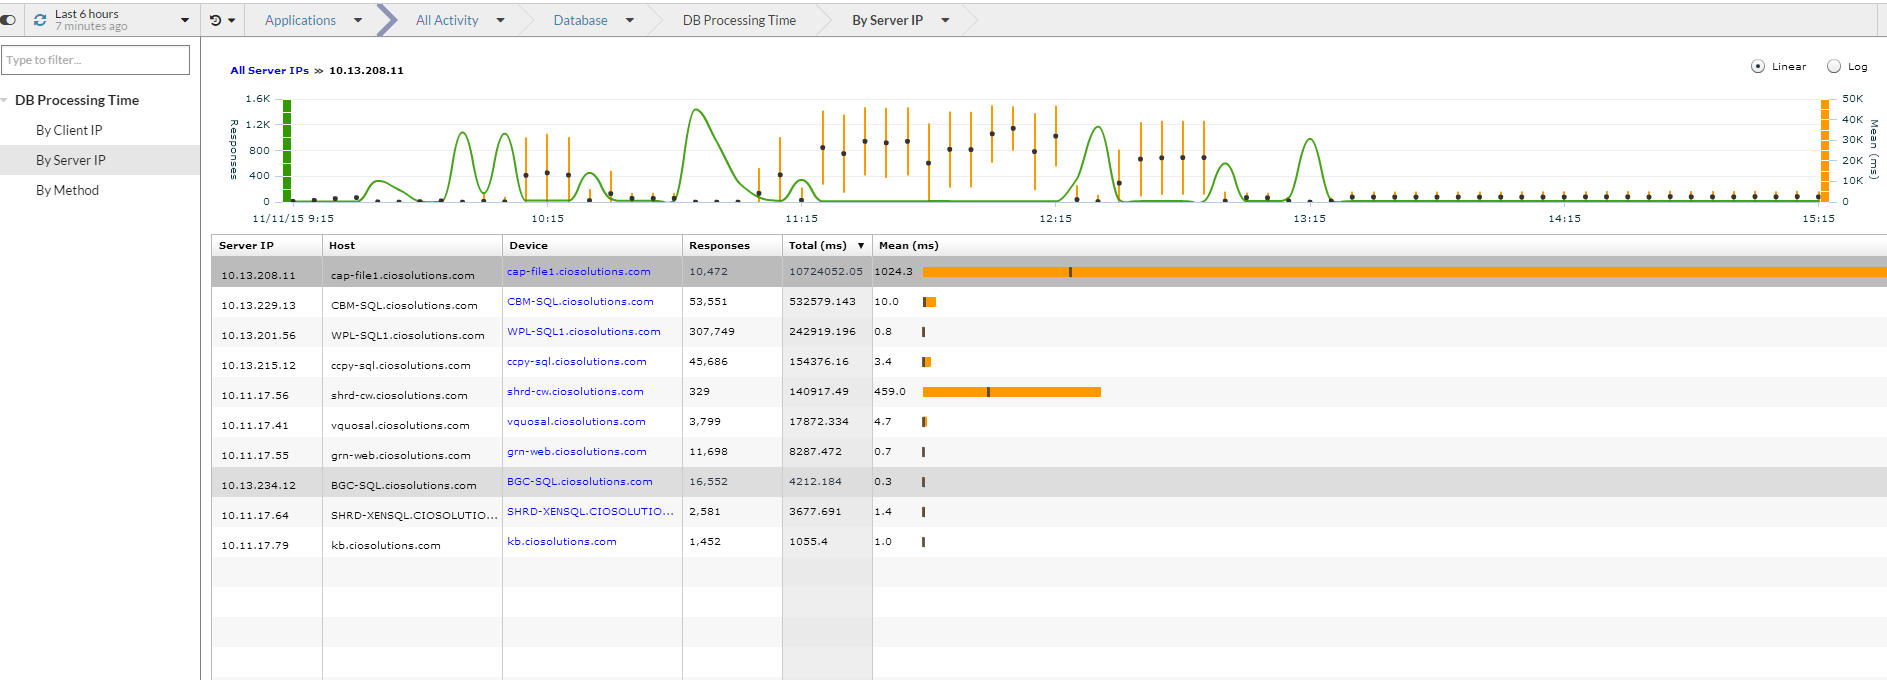
I can click on the device on click the client button to see which server the queries are sourcing from.

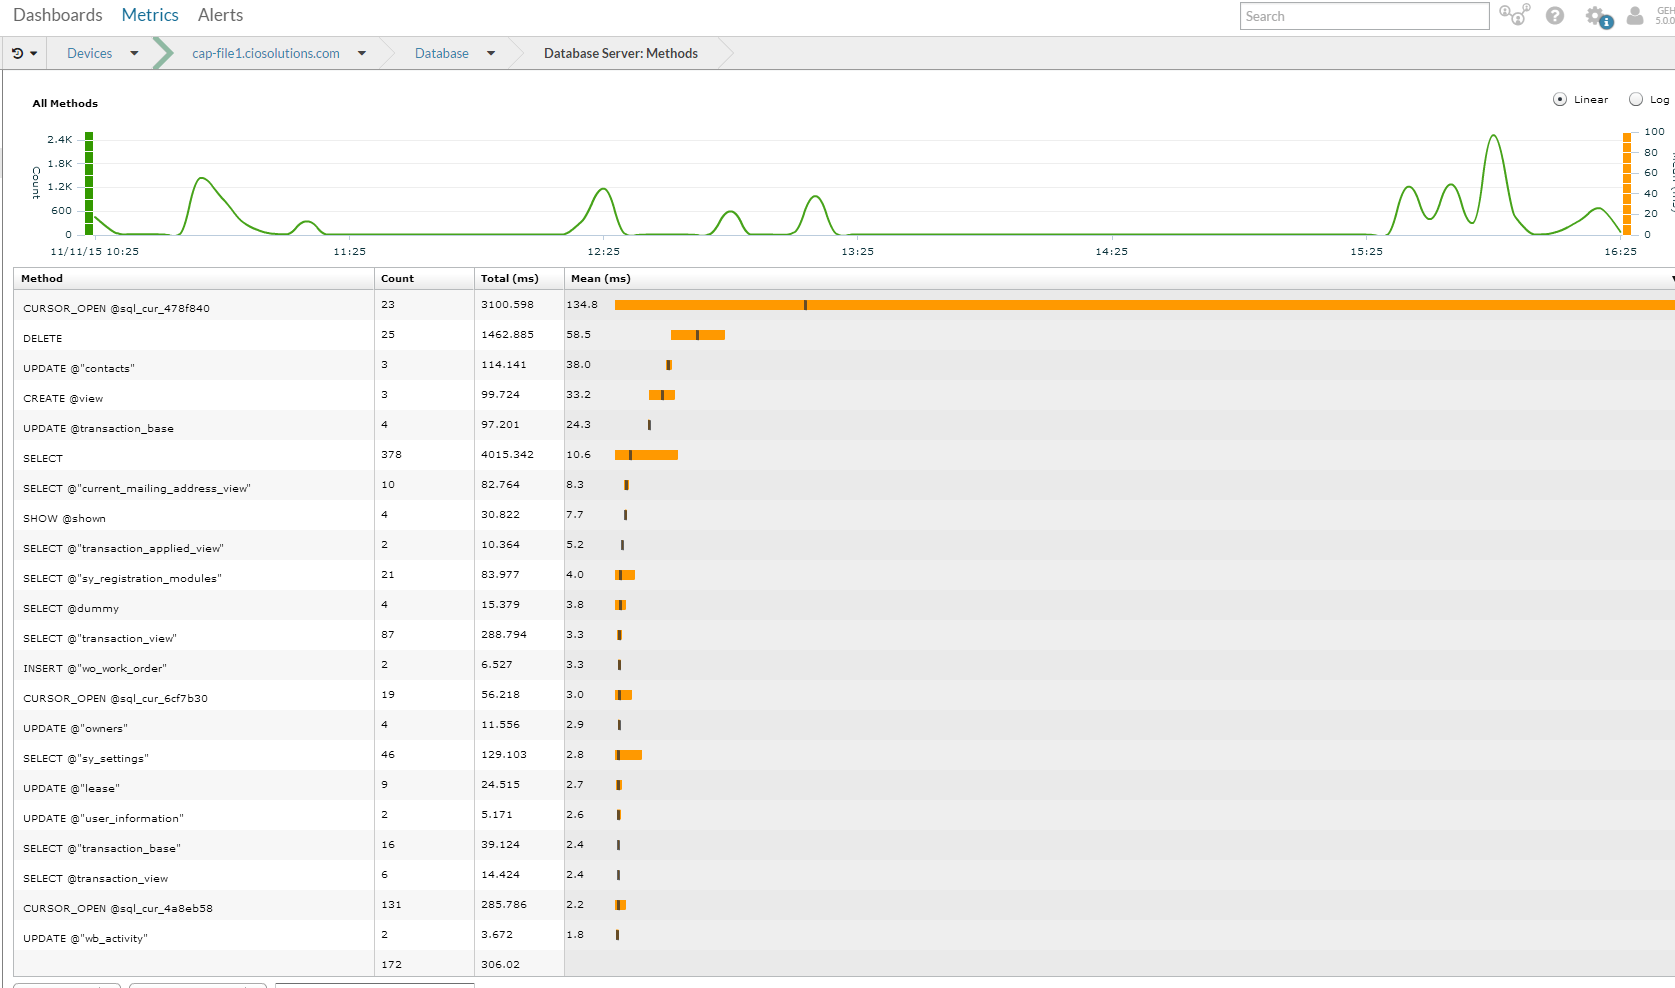
In addition I can click the methods button to see what methods are slow. In this case it is a method called cursor_open @sql_cur_478f840 that takes on average 134.8 ms to complete. I can also glean that because other queries are completing fast this is not a disk IO issue. If I was getting reports of slowness I would work the DBA or Application Vendor armed with this data…and guess what I didn’t even need to be a SQL DBA.
L2 Information
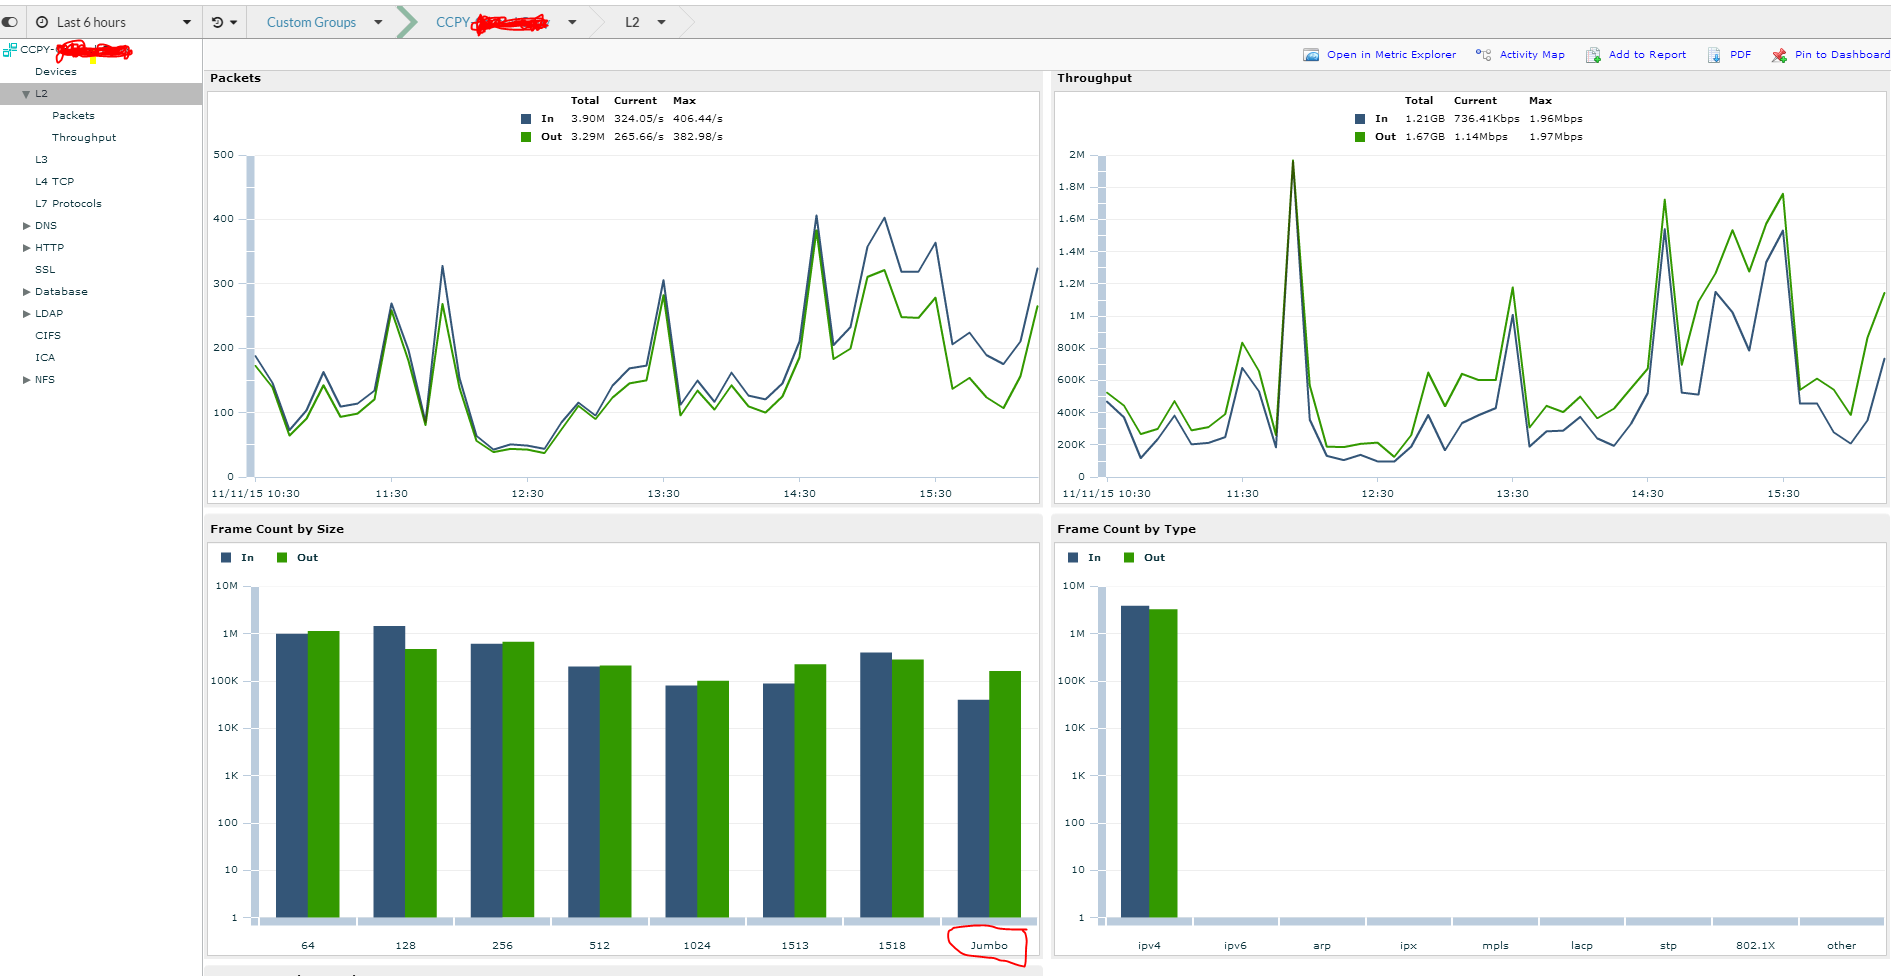
This is some great information that is only available with wire data. In this example we have group of servers that includes a customer’s file servers and xenapp servers and web servers. You can see in the left pane that I can find out all sorts of use information about this group in aggregate…much of which we covered. However we also have L2 information. For me what is particularly interesting is the JUMBO Frames…I thought JUMBO frames was only useful with iSCSI. Why are my servers using JUMBO frames? I have no idea and hoping Extra Hop can shed some light on why this might be. For me the key point is that with the Extra Hop tool I have either just found an issue that I can address or found something that enables me to understand the details of my environment deeper than I ever could have before.
File
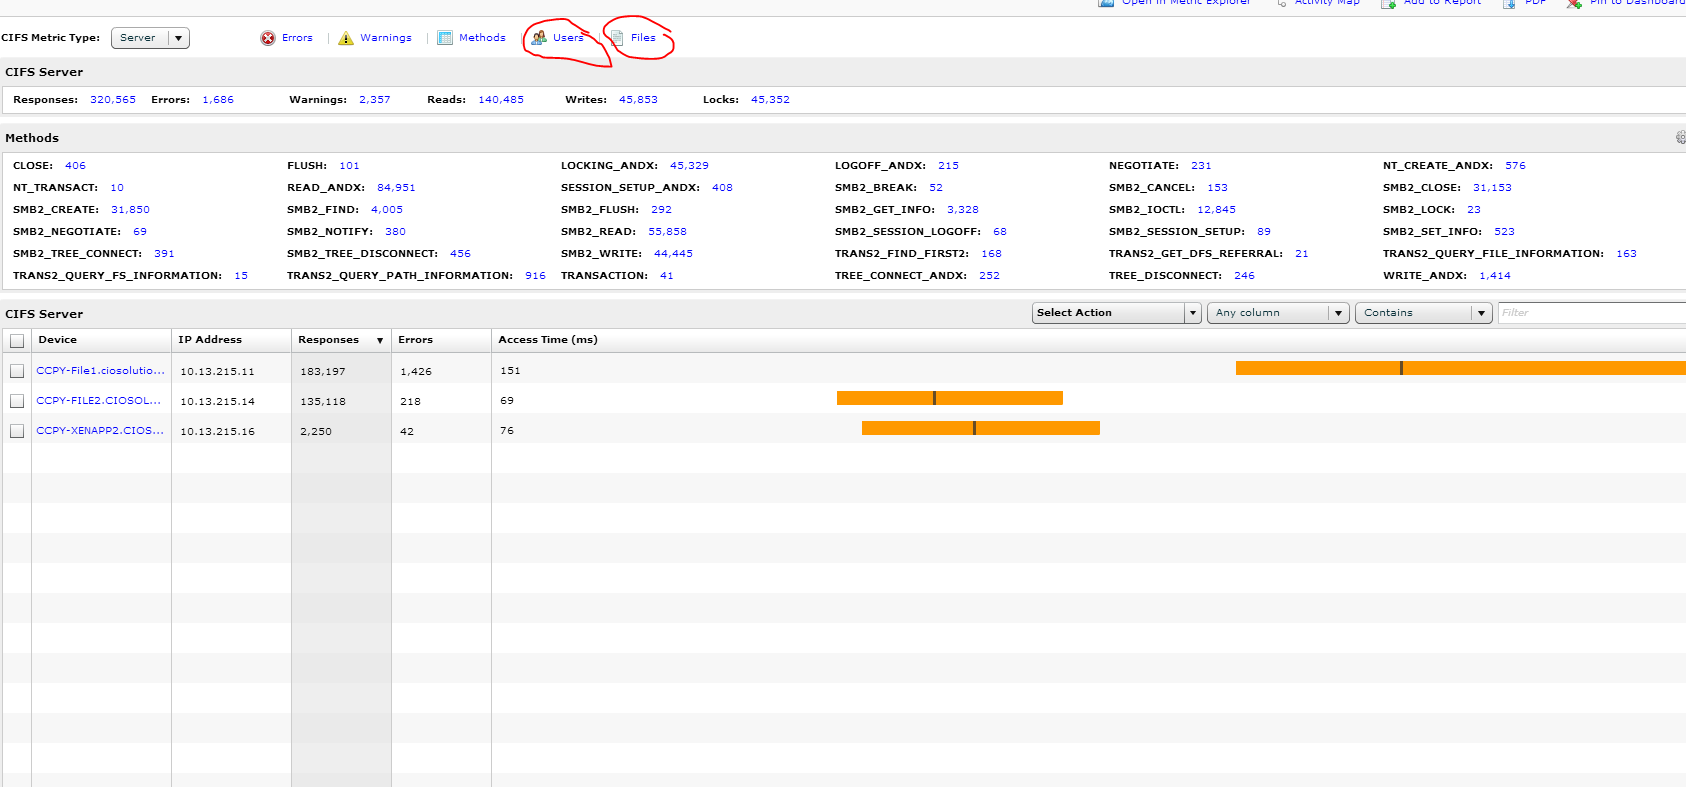
This is simply awesome visibility not found in any tool I have ever used. I have selected the same group as before, which is made up of a xenapp server and 2 file servers. I want to understand what files have been accessed and which users are accessing files.

You can see the list of users and how many bytes they have accessed. Interesting that you can see \\pre-login and \\anonymous users. Why is anonymous access the file server and should it be. That is the question I will be looking to answer but don’t have sufficient knowledge to answer now.

You can also see the files and how many times they have been open.

I want to be able to look at which users opened which files but couldn’t seem to find it. It seems like if this is possible then I have some great compliance related reports.
Geomaps
This is an interesting way to have a heat map about where people are connecting from. Thanks to our trusty Palo Alto Firewall and  Geo IP I can see that only companies in the US are connecting to our systems.
There is still so much more to review. I didn’t get into HTTP or Citrix protocols nor did I look at TCP protocol where Extra Hop can help find issues related to congestion and packet loss. I will be following up at a later date on this topics as well as going over some internal issues that extra hop was able to help us identify, i.e. real world problem solving with Extra Hop. I also want to dive into the operational aspects, i.e. how to setup your NOC and what dashboards are good for Support Tier 1 vs Support Tier 3. I
Product Comparison
Extra Hop vs Solarwinds – Solarwinds has a suite of tools but most them are based on SNMP/API model and centralized log management. It offers no where near the depth of Extra Hop.
Extra Hop vs Splunk – I am not a splunk expert but my experiences with it have been that it is a log parsing tool that also acts as a way to centrally store and retrieve this data. When I think of splunk I think of log management with some extra apps bake ontop..but most of those extra apps are not best of bread so trying to achieve a single pain of glass through Splunk is not practical unless you don’t care about your payroll budget. Setting up Splunk is also a pain as you need to go to each host and point its log files to splunk. Then you need to setup splunk to correctly ingest and structure those logs. This is not easy. On the other hand Extra is extremely easy as once you mirror all your data to it it simply starts working. Some networks do have complexities because it is not always clear the best way to design them to allow mirroring but this is a manageable and the advent of the DVS in vmware is making this a lot easier for virtual environments.
Extra Hop vs Nagios/Icinga – If you don’t value your people’s time then Nagios is a powerful SNMP/API monitoring system backed by the open source world but it doesn’t do wire data.
Paradigm Comparisons
Extra Hop vs Flow Analyzers – Flow Analyzers only get a subset of the data and often use sampling techniques to reduce the traffic on the network. They are great for what they are which is to get visibility into the traffic cross your network…but that visibility tends to be sessions/port based. It is 1 dimensional data and many companies believe they need a Flow Analyzer…that is until they get a flow analyzer and don’t know how to make it useful in their day to day operations. In my opinion Flow Analyzers are being less important as firewalls get better analytics built into them and the Flows on the LAN are not relevent when you have better tools like Extra Hop.
Extra Hop vs Centralized Log Management or SIEM – Extra Hop does not replace this. It can augment it from a security/compliance standpoint as wiredata has very useful forensic aspects to it but it can’t replace a true Centralized Log Management system.
Extra Hop vs SNMP/API tool – Extra Hop doesn’t replace these tools although often times I could. The things it doesn’t help with are CPU and Memory usage…but as these tools become more and more commoditized the difference between them is reliable.