Summary:
In this article, I explore the cost implications of the new Microsoft Server 2016 Per Core pricing model focusing exclusively on SPLA pricing . There isn’t much info on the web that takes a holistic look at cost implications which is why I decided to post my results and the spreadsheet. Specifically I wanted to look at total monthly cost per VM including hardware cost, rack space and Ethernet Switches for various core per node configurations. The other item that motivated me was to create a tool to help determine the ideal hardware configurations for Citrix Xenapp workloads vs General Infrastructure workloads which both have very different requirements. To do this I created a calculator that allows you to compare solutions, various node configurations within a solution and different workload requirements all in a simple excel sheet. This approach should work to 1000 -2000 VM’s environments. It should also be noted that this approach is not a true cost per VM but rather a relative cost so that comparisons can be made between solutions.
I am going to use this calculator to show an analysis of two SuperMicro solutions each with 3 different hardware configurations. I used www.thinkmate.com to get pricing as they have a killer configuration app. Remember one of our main goals is to understand SPLA pricing impact and in order to have a holistic understanding we need to combine SPLA licensing costs with space, power and hardware costs that various configurations provide. I want to emphasis again how the new Microsoft Server 2016 per Core pricing model for SPLA dramatically changes the buying dynamics and the assumptions previously made when buying compute/server hardware. The old model of buying the fastest CPU in the sweet spot of price isn’t always the best strategy and in fact can cost you a lot of money.
Variables:
We will start by filling out the variables in the calculator. The workload variables is the first section and allows you to pick two different workloads. We used Citrix Xenapp vs General Infrastructure workloads. Our Xenapp model requires 1.5 vCPU to pCPU ratios where each xenapp VM is 4 vCPU X 16 GB. This is in sharp contrast to our infrastructure vm’s where we have much better densities and hence much higher vCPU to pCPU ratios. In addition our average vCPU and Memory per Guest are lower with our Infrastructure VM’s. In our particular environment xenapp servers are very consistent, i.e. each xenapp server has the same vCPU and Memory as the next one whereas our the general purpose infrastructure have lots of variation in their vCPU and Memory. Accordingly we just use the averages for the infrastructure workload. You can safely ignore the cost per Xenapp VM Tolerance as that is a filter that is used at the end of the analysis.
Next we fill out the general variables. This includes Window Server Std SPLA per core pricing and Windows Server Datacenter SPLA per core pricing. The calculator also requires you to fill out our cost per U. For the purposes of this comparison just take the monthly cost of a rack at your co-location(including power) and divide by the rack size, in our case 42. I mentioned this above but a lot of the costs in this model are relative, this is one such number. This means you do not need to figure out the space for firewalls or SANs or things that remain consistent between the solutions. This calculator also assumes that power usage is similar between solutions which may not be true and could have major cost consequences if you are in a datacenter with metered power. We are not as our power comes with our racks and hence that is the assumption in this calculator. If you wanted to add power usage differences between nodes and solutions you would simply need to determine power usage per VM, the costs associated with that power usage and add it to the Per VM cost table.

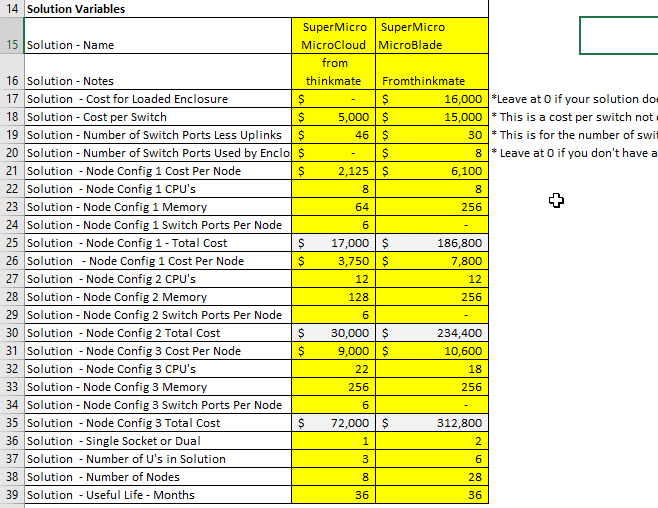
The solution variables is the third set of variables to be filled out. Most of the fields should be obvious but I will review some to help.
You will need to fill out the total cost for enclosure if there is one. This would be the cost for the fans, powersupplies, management modules, internal switching modules.
You will need to fill out the cost for a single switch, this is mainly to differentiate between high density 1Gbs switches that some solutions require vs 10Gbs switches. You do NOT put in the total cost for all switches to support the solution. For the switch you will also need to fill out the number of access switch ports available, i.e. the number of ports on the switch minus the number of ports used for uplinks. The calculator understands that you will use ToR switches and LAG…you do not put this information in. For the number of switch ports used by the enclosure just put the number of ports for the enclosure to connect to the switches. In the case of a blade system we typically have a LAG for VM Traffic, Management and VMotion and a LAG for Storage then we have two IO Modules so the total number of 10Gbs ports used is 8.
For each node/server configuration option that you want to compare list the cost for the node and how much CPU and memory it comes with. You can do up to three node options within a given solution. You will need to provide the calculator with the # of nodes each solution comes with and how many U’s the solution takes up.
The useful life variable amortizes the total capital over this period. I like to keep it the same between solutions to get the best comparison but that may not be accurate depending on your equipment. The long the useful life the more that space, power and licensing dominate the monthly cost. The longer the useful life the less important the cost of the equipment becomes as space and licensing costs dominate the costs.
Tables:
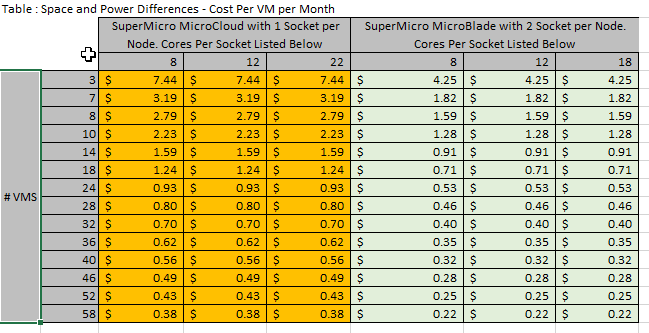
The first table we calculate is the space and power per VM for each solution and each configuration within the solutions. Obviously the more VM’s you get on each node the lower the cost per VM is.
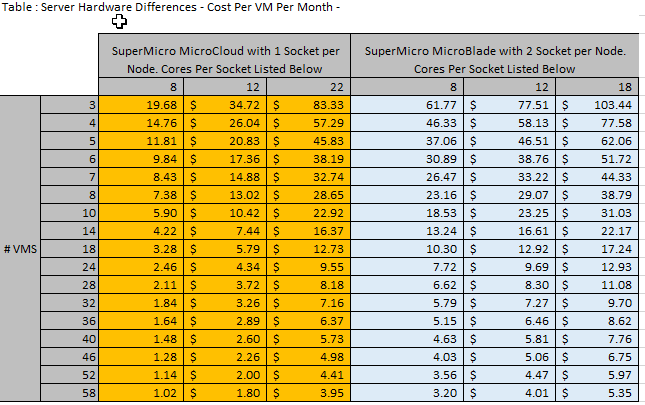
The next table shows the server hardware cost per VM. Intuitively for any given solution as you increase density you decrease cost per VM and that is what this table shows. This table is largely impacted depending on what useful life span you use. I used 36 months for this comparison but you could use 48 months or even 60 months depending.
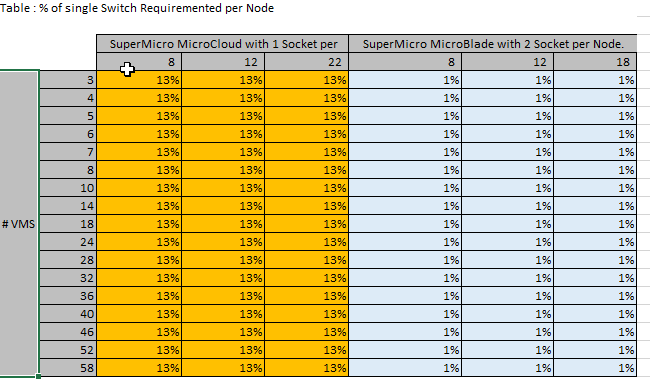
The next table shows the %capacity a given node uses that is available in a switch. Capacity is determined by the % of switch ports used. This table is what will easily allow us to calculate costs per switch, both capital and space and power costs. Since the % is per node not per VM the % will stay the same as the VM density increases.
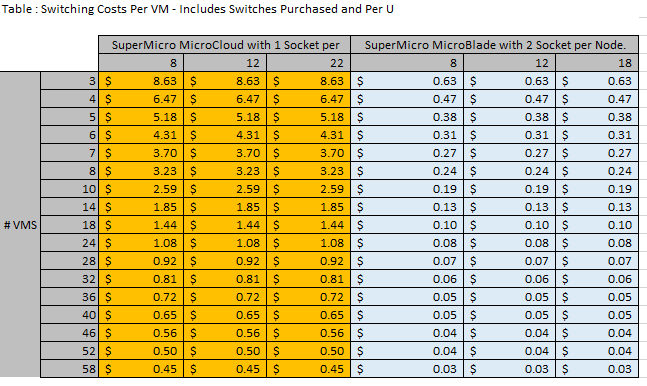
This next table shows the cost for the physical switches per VM. Intuitively, as the #vm’s goes up the costs per VM goes down. The interesting thing to note about this table though is that Microcloud does not use an enclosure and hence each node has its own direct connections to a switch where as the MicroBlade does use an enclosure and has Shared 10Gbs uplinks amongst the nodes. This means that the MicroCloud uses lots of switches and the MircoBlade does not, accordingly it drives down the switch costs per VM for the MicroBlade making it have a fraction of the switching costs compared to the MicroCloud. Essentially, on a per vm basis the switching costs for the MicroBlade are non material whereas for the MicroCloud they are very material.
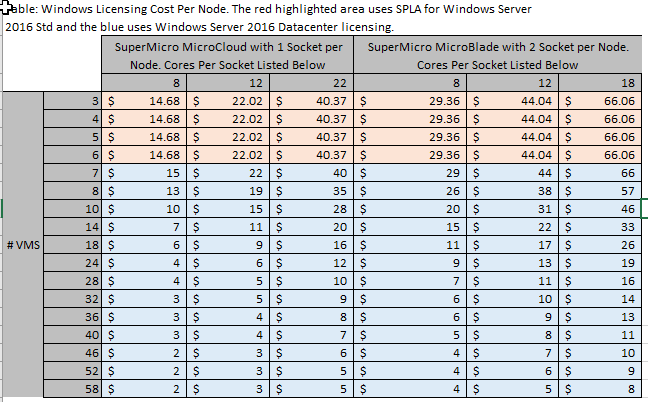
The next table shows the Microsoft Server Licensing cost per VM. Within a given configuration the pattern is very intuitive, i.e. you pay the same cost per VM until you get to datacenter licensing and then the cost per vm starts dropping. However something very interesting happens and that is your cost per VM between different node configuration is dramatically different. Take the cost per VM for the MicroCloud single socket 8 core system. It is $14.68 per VM. You will not reach that same price per VM on other configurations until much larger VM densities.
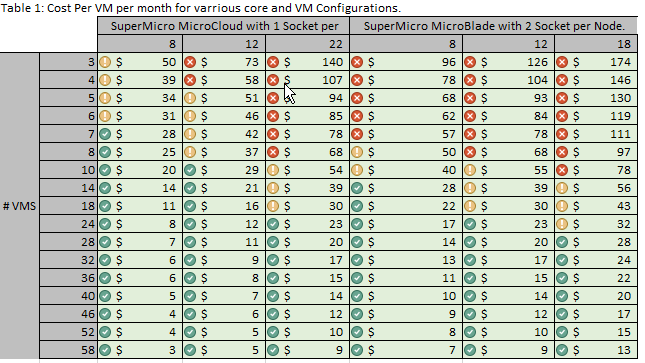
The next table shows the cost per VM by adding up all the other costs. This is a simple table that we will combine with other information to find out which nodes can support which # of VM’s based on the workload constrains entered into our calculator.
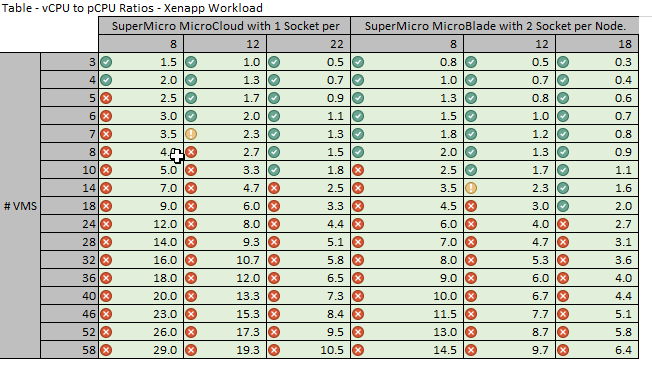
This next table shows the vCPU to pCPU ratios for each configuration and #of VM’s for the first workload. In our case it is a Citrix Xenapp Workload. You can see with xenapp that it is not possible to get high densities on a lot of these configurations without sacrificing our vCPU to pCPU ratios. In the real world when your vCPU to pCPU ratio climbs then your CPU ready time increases and your users scream.
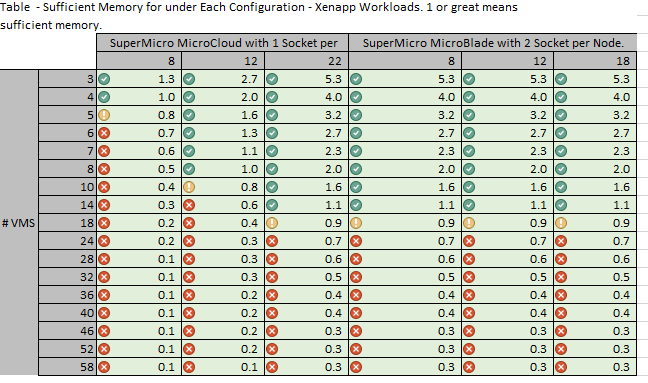
The next table shows which configurations have sufficient memory to handle the constraints for our Citrix Xenapp workloads. A value of 1 basically means the host’s memory is fully comitted to the VM’s and hence anything below 1 should be considered over-committed memory and avoided.
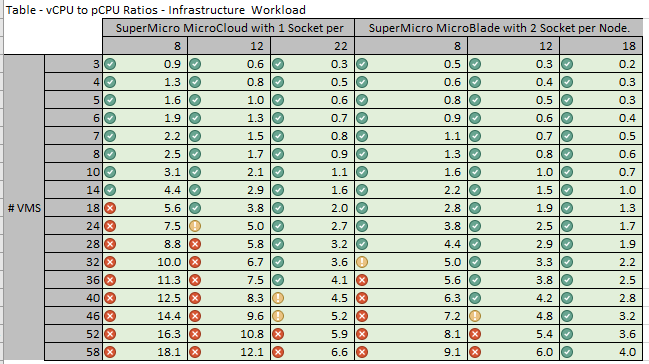
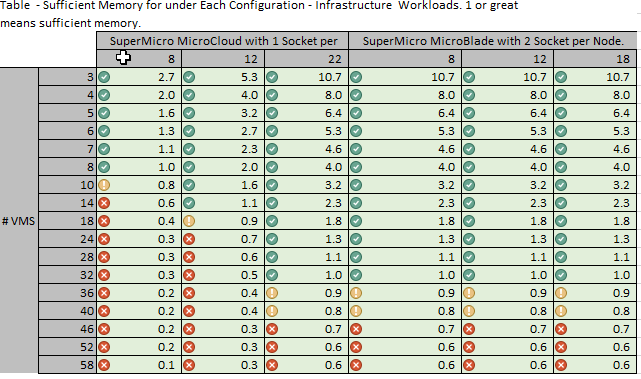
In the next two tables we calculate the pCPU to vCPU ratios and memory constraints for the second workload, i.e. the general infrastructure workloads.
Comparison Table
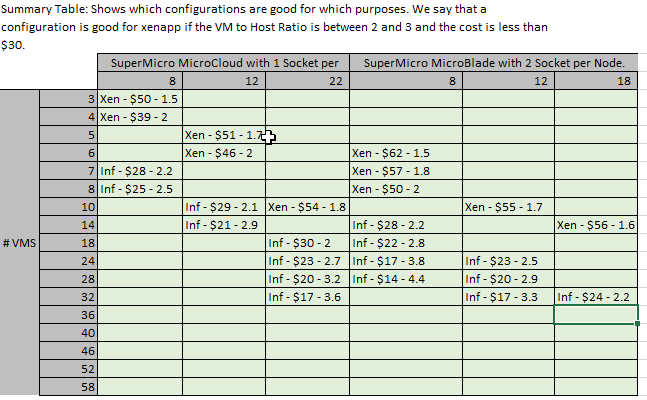
The table below is the final table and most important. For each configuration that works with a given workload it shows the workload name, the cost per vm and the vCPU to pCPU ratio for that solution. In our case we can see than xenapp is has the lowest cost per VM the single CPU 8 Core CPU MicroCloud. In this configurating having 4 VM’s on the system will give us a cost of $39 per VM with a vCPU to pCPU ratio of 2. None of the other configurations can go as low because they aren’t able to get the densities required to offset the higher price for windows datacenter. On the other hand, the infrastructure VM’s are best handled by the MicroBlade Dual CPU 12 core solution because it has a good mix of hardware costs(sweet spot) and the density required to make use of datacenter licensing. The MicroCloud 22 Core Solution would handle the infrastructure VM’s requirements and provide a low cost per VM.
Assumptions:
This model makes a number of assumptions that should be pointed out.
- We assume vCPU Ratio requirements stay consistent as you add more Cores. I don’t know if this is true.
- We assume management cost(payroll or consultants) is assumed fixed across solutions, this is not true in the real world as different solutions require different skillsets and amounts of management.
- We assume requirements stay fixed over the life of the system. This is not true as workload requirements may change over the years. Often times we buy hardware that is most likely to meet demands of the future.
- We assume the same power costs for each solution. This is not true if you are using a metered power Co-Location provider.
- We don’t put a price on risks associated with solution. For example I always assume solutions with more cabling have more risk of human error causing outages. There are many other risks between solutions that we don’t quantify.
- We assume cost of capital is fixed for both solutions . Cost of Capital might be more important in cases where each solution had different useful life or if the capital spread between solutions is large.
- We assume you are using like CPU’s between configurations. It is very easy to mis-calculate by using something like an 12 core 2.1 Ghz CPU in one solution vs a 12 core 2.6Ghz CPU in the other. This will result in big price difference between two solutions and make comparing a given workload between solutions inaccurate. The larger the node spread between solution 1 and solution 2 the more this has an impact.
- This doesn’t take into account switching that gets more complex due to aggregation layers that might be required.
- The solution assumes equal SAN configurations for Solution 1 and Solution 2.
- This does not factor in backup costs. This would only matter if your backup solution is per socket or per core rather than per VM.
- This does not factor in other per core or per socket costs related to your datacenter which would impact the cost comparison. Other examples could include vmturbo or hypervisor integrated antivirus.
Hyper Convergence:
It is possible to use this tool for Hyper Convergence comparisons. You can do this by adding in the SAN and SAN fabric cost to the enclosure cost variable.
Hopefully this article and calculator can help those looking to determine the best configurations with the new Windows Server 2016 licensing requirements.